
Land-Based Removals
SCOPE 1 – NET CHANGE IN OUR TIMBERLANDS
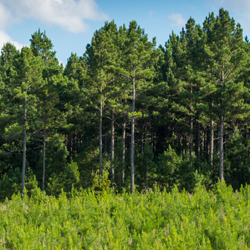
The amount of carbon stored in our timberlands changes over time. These changes occur due to tree growth, harvests, natural disturbance, and other factors. Because harvest removes carbon from the land base (transitioning much of it into storage in wood products) and tree growth adds carbon to the land base, we are interested in understanding how the amount of carbon stored on our land varies over time. Because the actual amount changes nearly constantly, we quantify the net change by comparing the carbon storage in our forests at year-end to the beginning of the year.
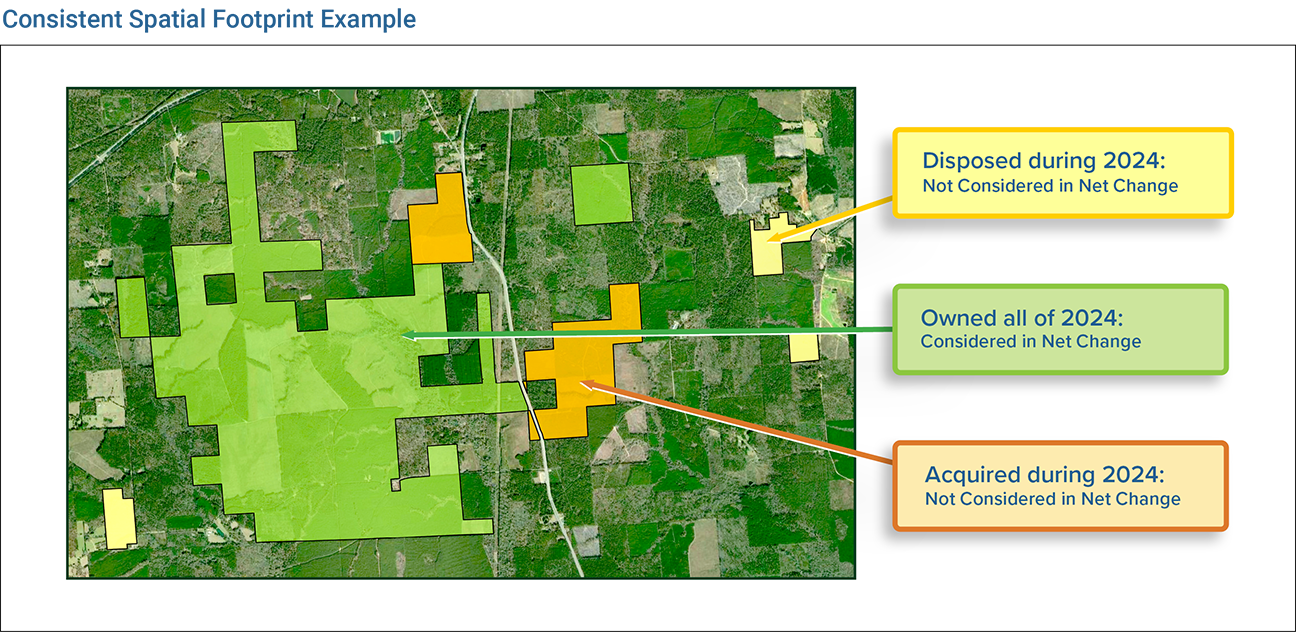
To avoid conflating the effects of our management activities with the changes of our land base, we compare carbon storage only on acreage we owned for the full calendar year. The use of this consistent spatial footprint for analysis means any acquisitions or divestitures that occurred during the year are omitted. Therefore, we exclude lands acquired during 2024.
Keeping track of carbon storage in standing trees and carbon removals via tree growth is compatible with the way we keep track of our standing tree inventory and growth. As with any actively managed forests, a variety of changes can occur throughout the year that affect the standing amount of carbon. Some major activities that can alter the inventory in an area are harvests, growth, and updated stand inventory (newly collected data). The magnitude of the annual change associated with these activities is tracked.
The basis of our tree and carbon inventories has two major components, inventory cruising and growth modeling. Our inventory cruising program involves ground-based sampling in our forests to get a tree list for stands. Since stands are not sampled every year, our growth models estimate growth in the stands in the interim between samples. This allows us to have an up-to-date inventory value for every stand in our ownership at the end of every year.
At year-end, we take these stand level tree lists and apply well-documented biomass estimators and species-specific moisture contents to calculate component-based carbon inventories for our land base.1,2 The difference between standing carbon at year-end compared to the beginning of the year is the net change for that year.
In 2024, we calculated the net change in our forests (our Scope 1 timberlands value) for three carbon pools: 1) merchantable portions of trees, 2) above-ground non-merchantable portions of merchantable trees and pre-merchantable trees, and 3) below-ground portions of all trees (excludes soil carbon).
In 2024, above ground tree growth on our timberlands removed approximately 7.8 million metric tons of CO2e from the atmosphere. Harvest and other inventory adjustments totaled 8.6 million metric tons of CO2e, the net flux in our forests was an increase of 800,000 metric tons of CO2e in our above-ground standing stock. The annual net change in our forests did not result in an emission as a large proportion of the carbon in harvested wood products moved into a long-term storage pool. The decrease occurred because of harvest, mortality, or other inventory changes exceeding growth during the year. A sizable portion of the decrease was driven by geographically distributed remotely sensed inventory updates, a concerted effort to close out multiyear harvests, and adjustments made to capture tree mortality.
SCOPE 3 – NET CHANGE IN FORESTS OF OUR SOURCING REGIONS
Each of our mills has a geographic sourcing region. The carbon stored in forest pools in each of these sourcing regions changes over time with the local timberlands of a region either acting as a sink or a source of atmospheric carbon. Carbon sinks absorb more carbon than they release, while carbon sources release more carbon than they absorb. Although forests are typically carbon sinks, they can become carbon sources if disease and other disturbances cause forests to die and decay or when forests are converted to other land uses.
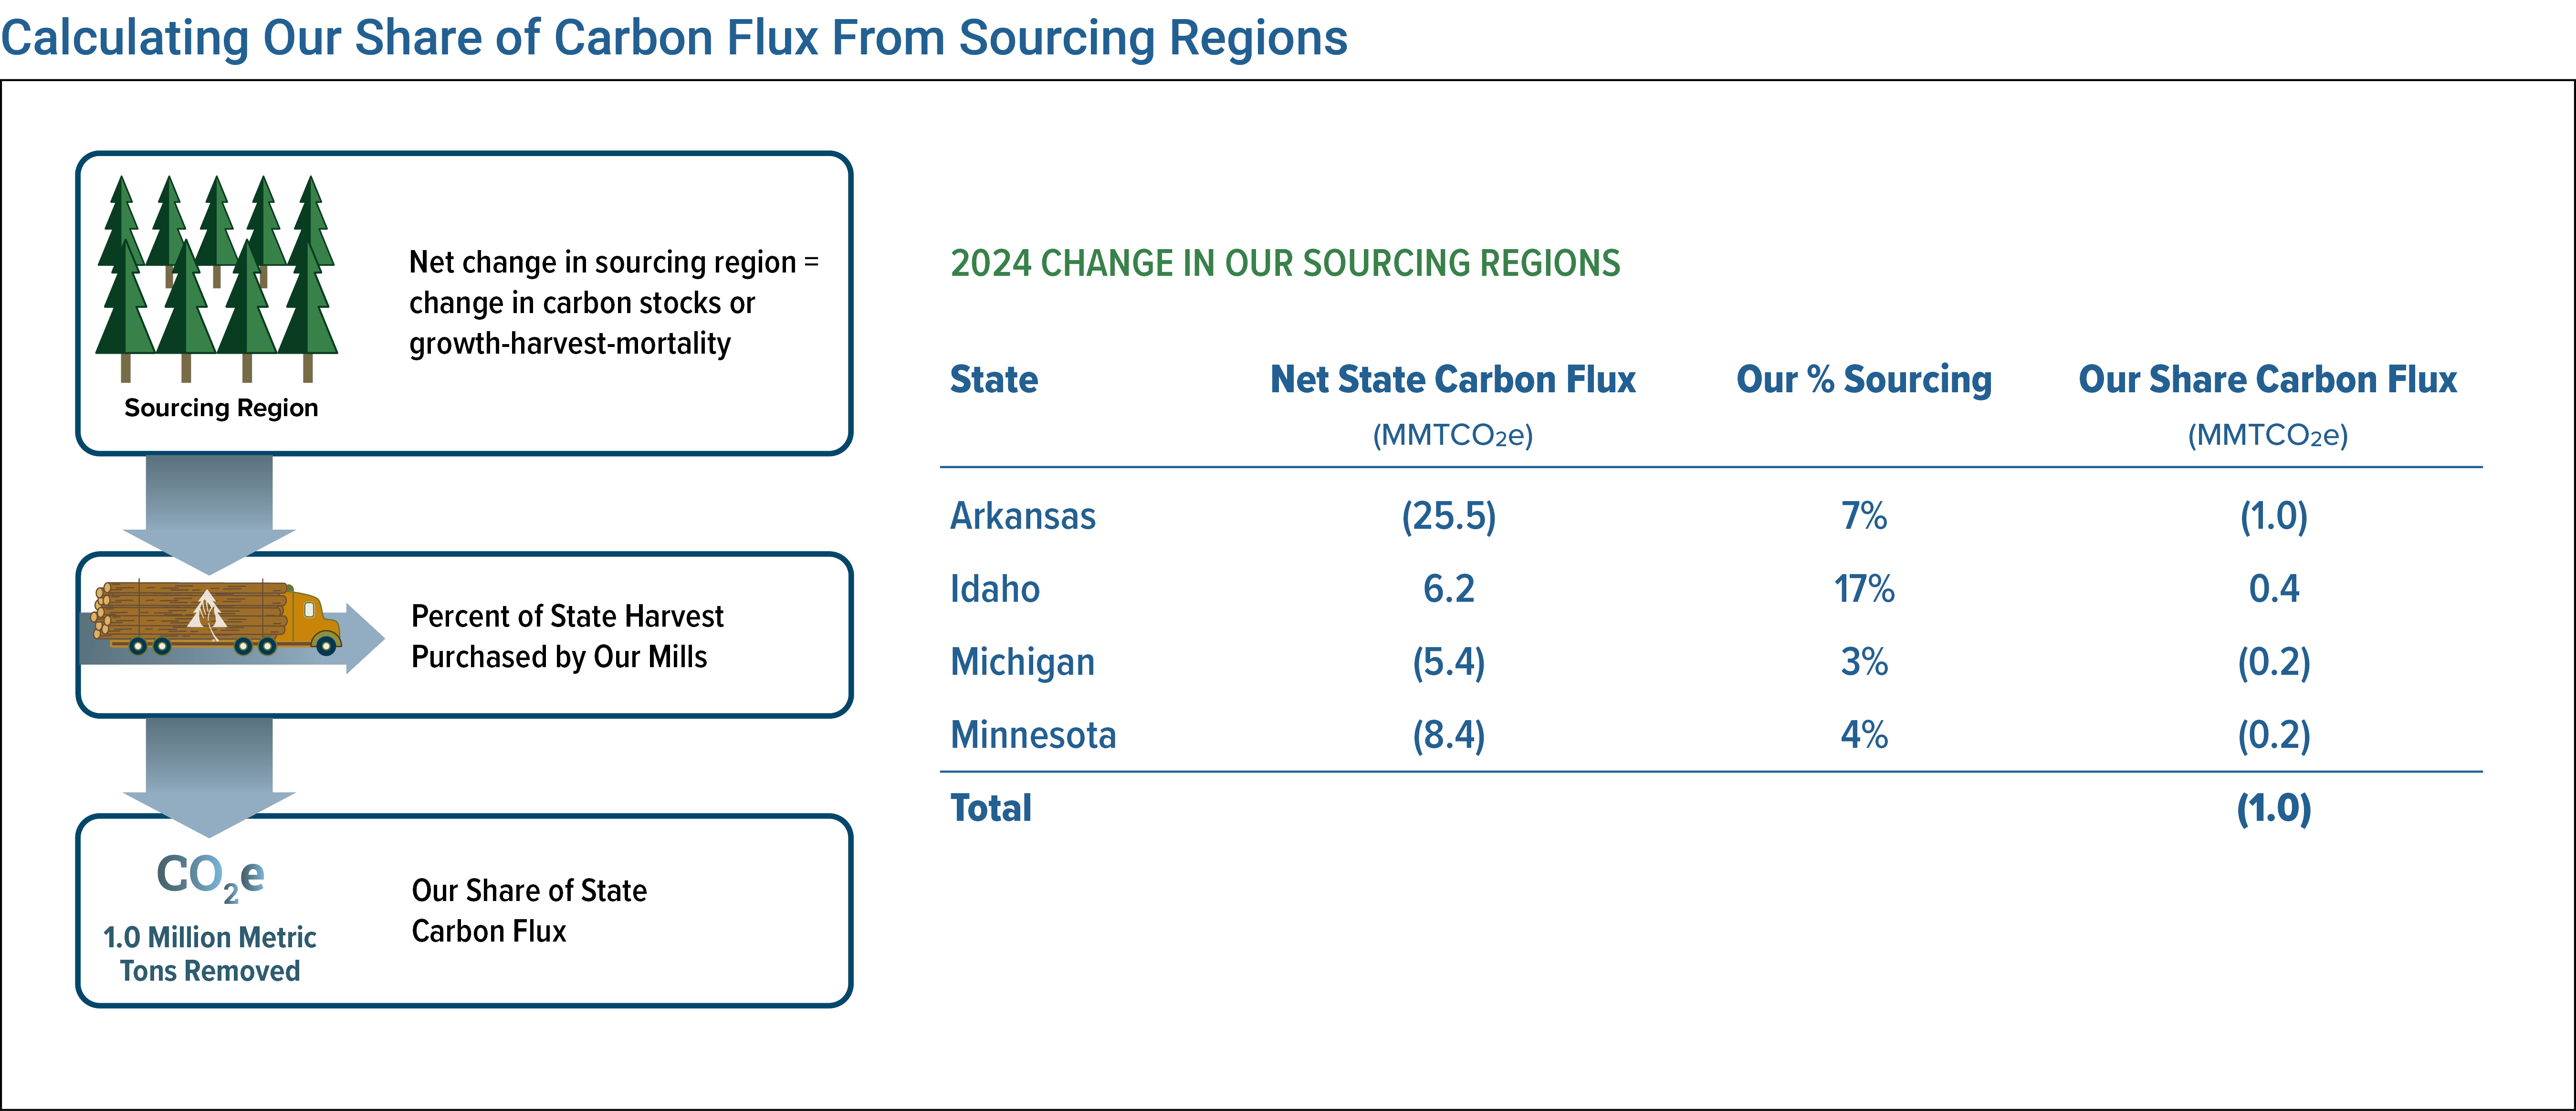
The intention of accounting for carbon from non-owned forests where we source fiber is to bring the sourcing region flux into our Scope 3 GHG inventory. In doing so, this aggregates the net effect of activities including harvest, natural mortality, fire, and economic investment in forest management. The amount (expressed as a percentage) of the regional carbon flux attributed to a mill should be equal to the amount (also expressed as a percentage) of the logs harvested in the geographic sourcing region from non-owned forests that the mill consumes.
For carbon accounting purposes, we consider the sourcing region for a mill to be the state in which the mill is located. We calculate the statewide net flux in above ground carbon using both a U.S. Department of Agriculture (USDA) GHG Emission Report and a pre-release beta version of the American Forest Foundation (AFF) Carbon tool provided by The National Council for Air and Stream Improvement, Inc. (NCASI).3,4 We use the estimated overall harvest in the state and calculate the land-based carbon flux associated with those harvests. We then determine our sourcing from the harvest in the state through our wood products facility usage data and establish our allocation of the land-based carbon flux associated with those harvests.
In 2024, we owned and operated wood products facilities in 4 states: Idaho, Arkansas, Minnesota, and Michigan. Arkansas, Minnesota, and Michigan forests were a net sink of carbon, which is shown by a negative value in the chart below, while Idaho forests were a net source, which is shown by a positive value in the chart below. Our calculated combined contribution to the net change for these states was an atmospheric removal of carbon equal to approximately 1 million metric tons of CO2e.
Idaho forests have become a source of carbon emissions primarily because of declining forest carbon storage on public forest lands resulting from slow growing older stands of trees and tree mortality from insects, disease, and fire in unmanaged stands. The carbon stored in wood products from harvested trees is not included in the state sink / source calculations.
SCOPE 3: STORED IN LOGS WE SELL EXTERNALLY
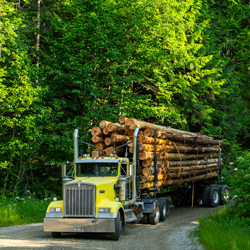
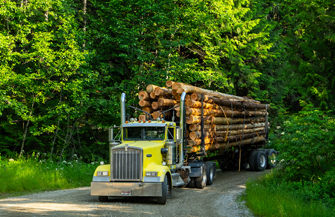
Some of the sawlogs harvested from our timberlands are sent to customers to be converted to wood products such as lumber and plywood. In addition, smaller wood from forest thinnings or treetops are often sent to customers as fiber to produce a wide range of end products including paper, packaging, and other uses.
Our carbon storage analysis for external log sales is based on the type of log sold. We track all log volumes harvested from our timberlands and delineate them by species, product classes, and products being manufactured (hardwood vs. softwood, pulpwood vs. sawlog, plywood vs. dimensional lumber, etc.). We estimate the average carbon stored over 100 years in each log category sold using USDA’s Quantifying Greenhouse Gas Fluxes in Agriculture and Forestry: Methods for Entity-Scale Inventory (Table 6-a-5 and Table 6-a-6).5 The publication provides 100-year average product storage by region and log category.
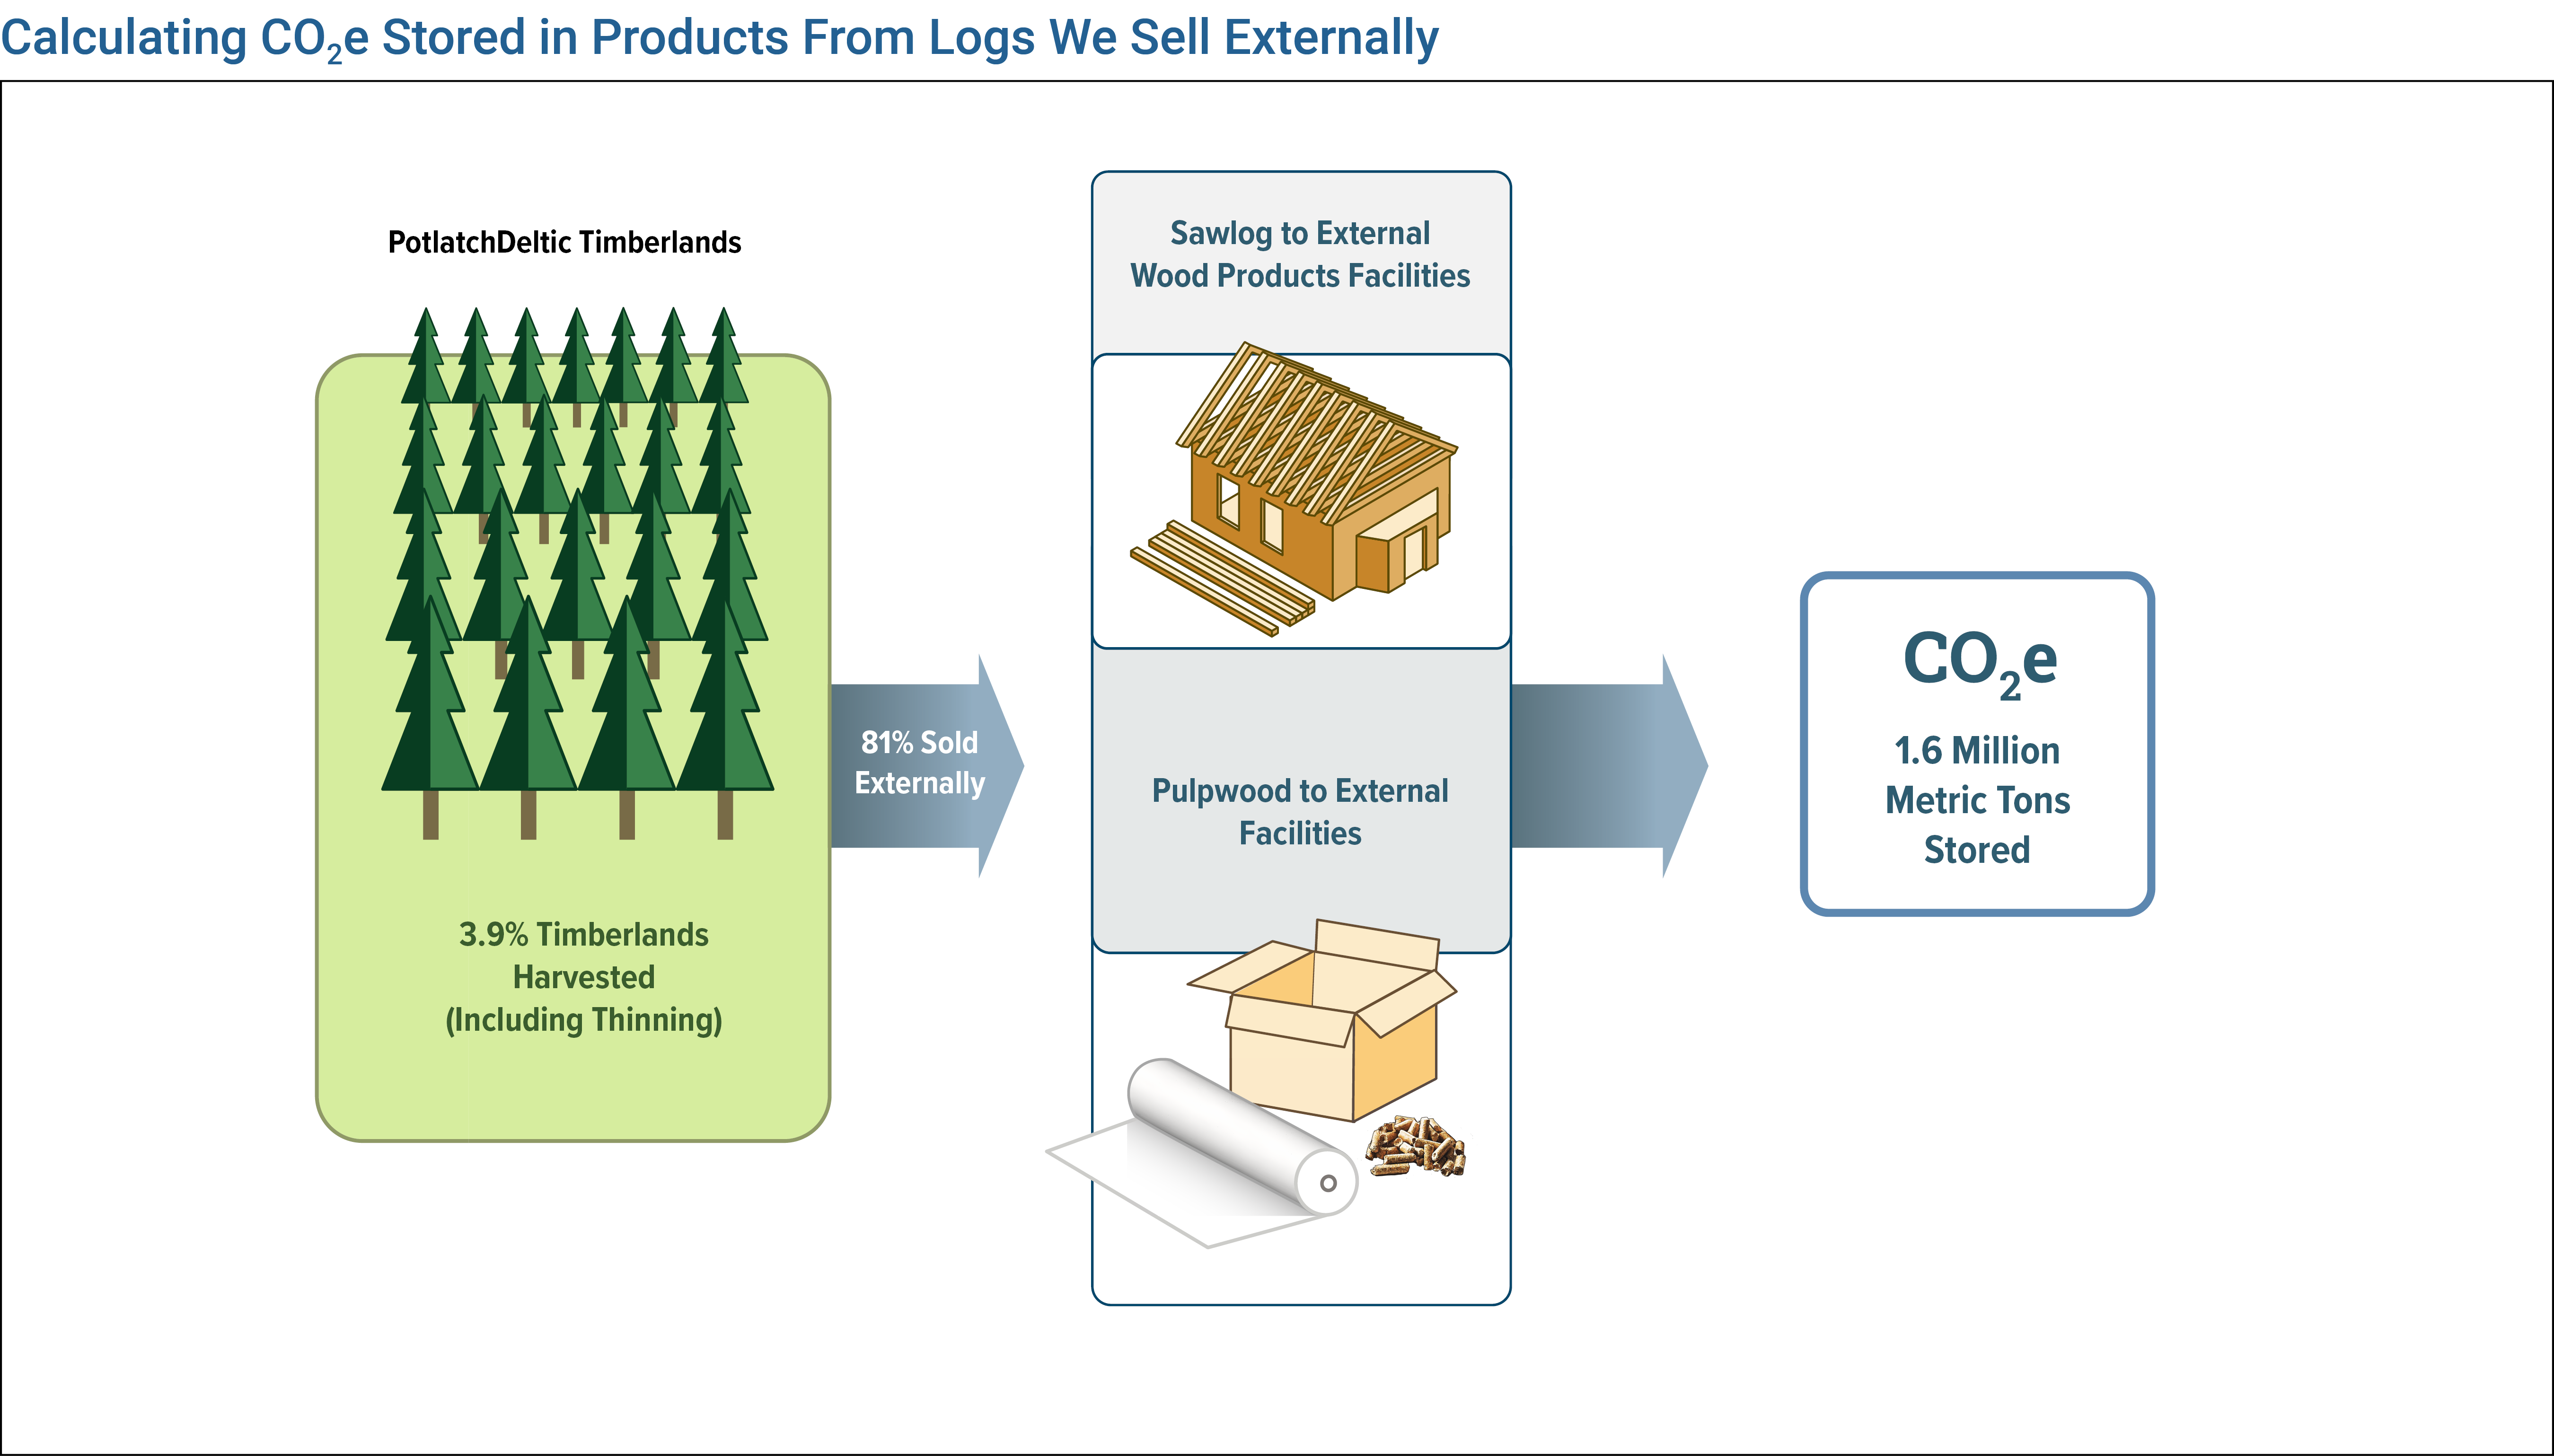
In 2024, we sold approximately 6.2 million tons of fiber harvested from our own timberlands externally to mills owned by others. Approximately 54% of these external fiber sales consisted of sawlogs with 46% being pulpwood. Nearly all delivered logs were softwood, with approximately 5% consisting of hardwoods. Using the GHG methodology described above, this amount of harvested fiber is expected to store an average of approximately 1.6 million metric tons of CO2e over the next 100 years.
SCOPE 3: STORED IN WOOD PRODUCTS WE MANUFACTURE
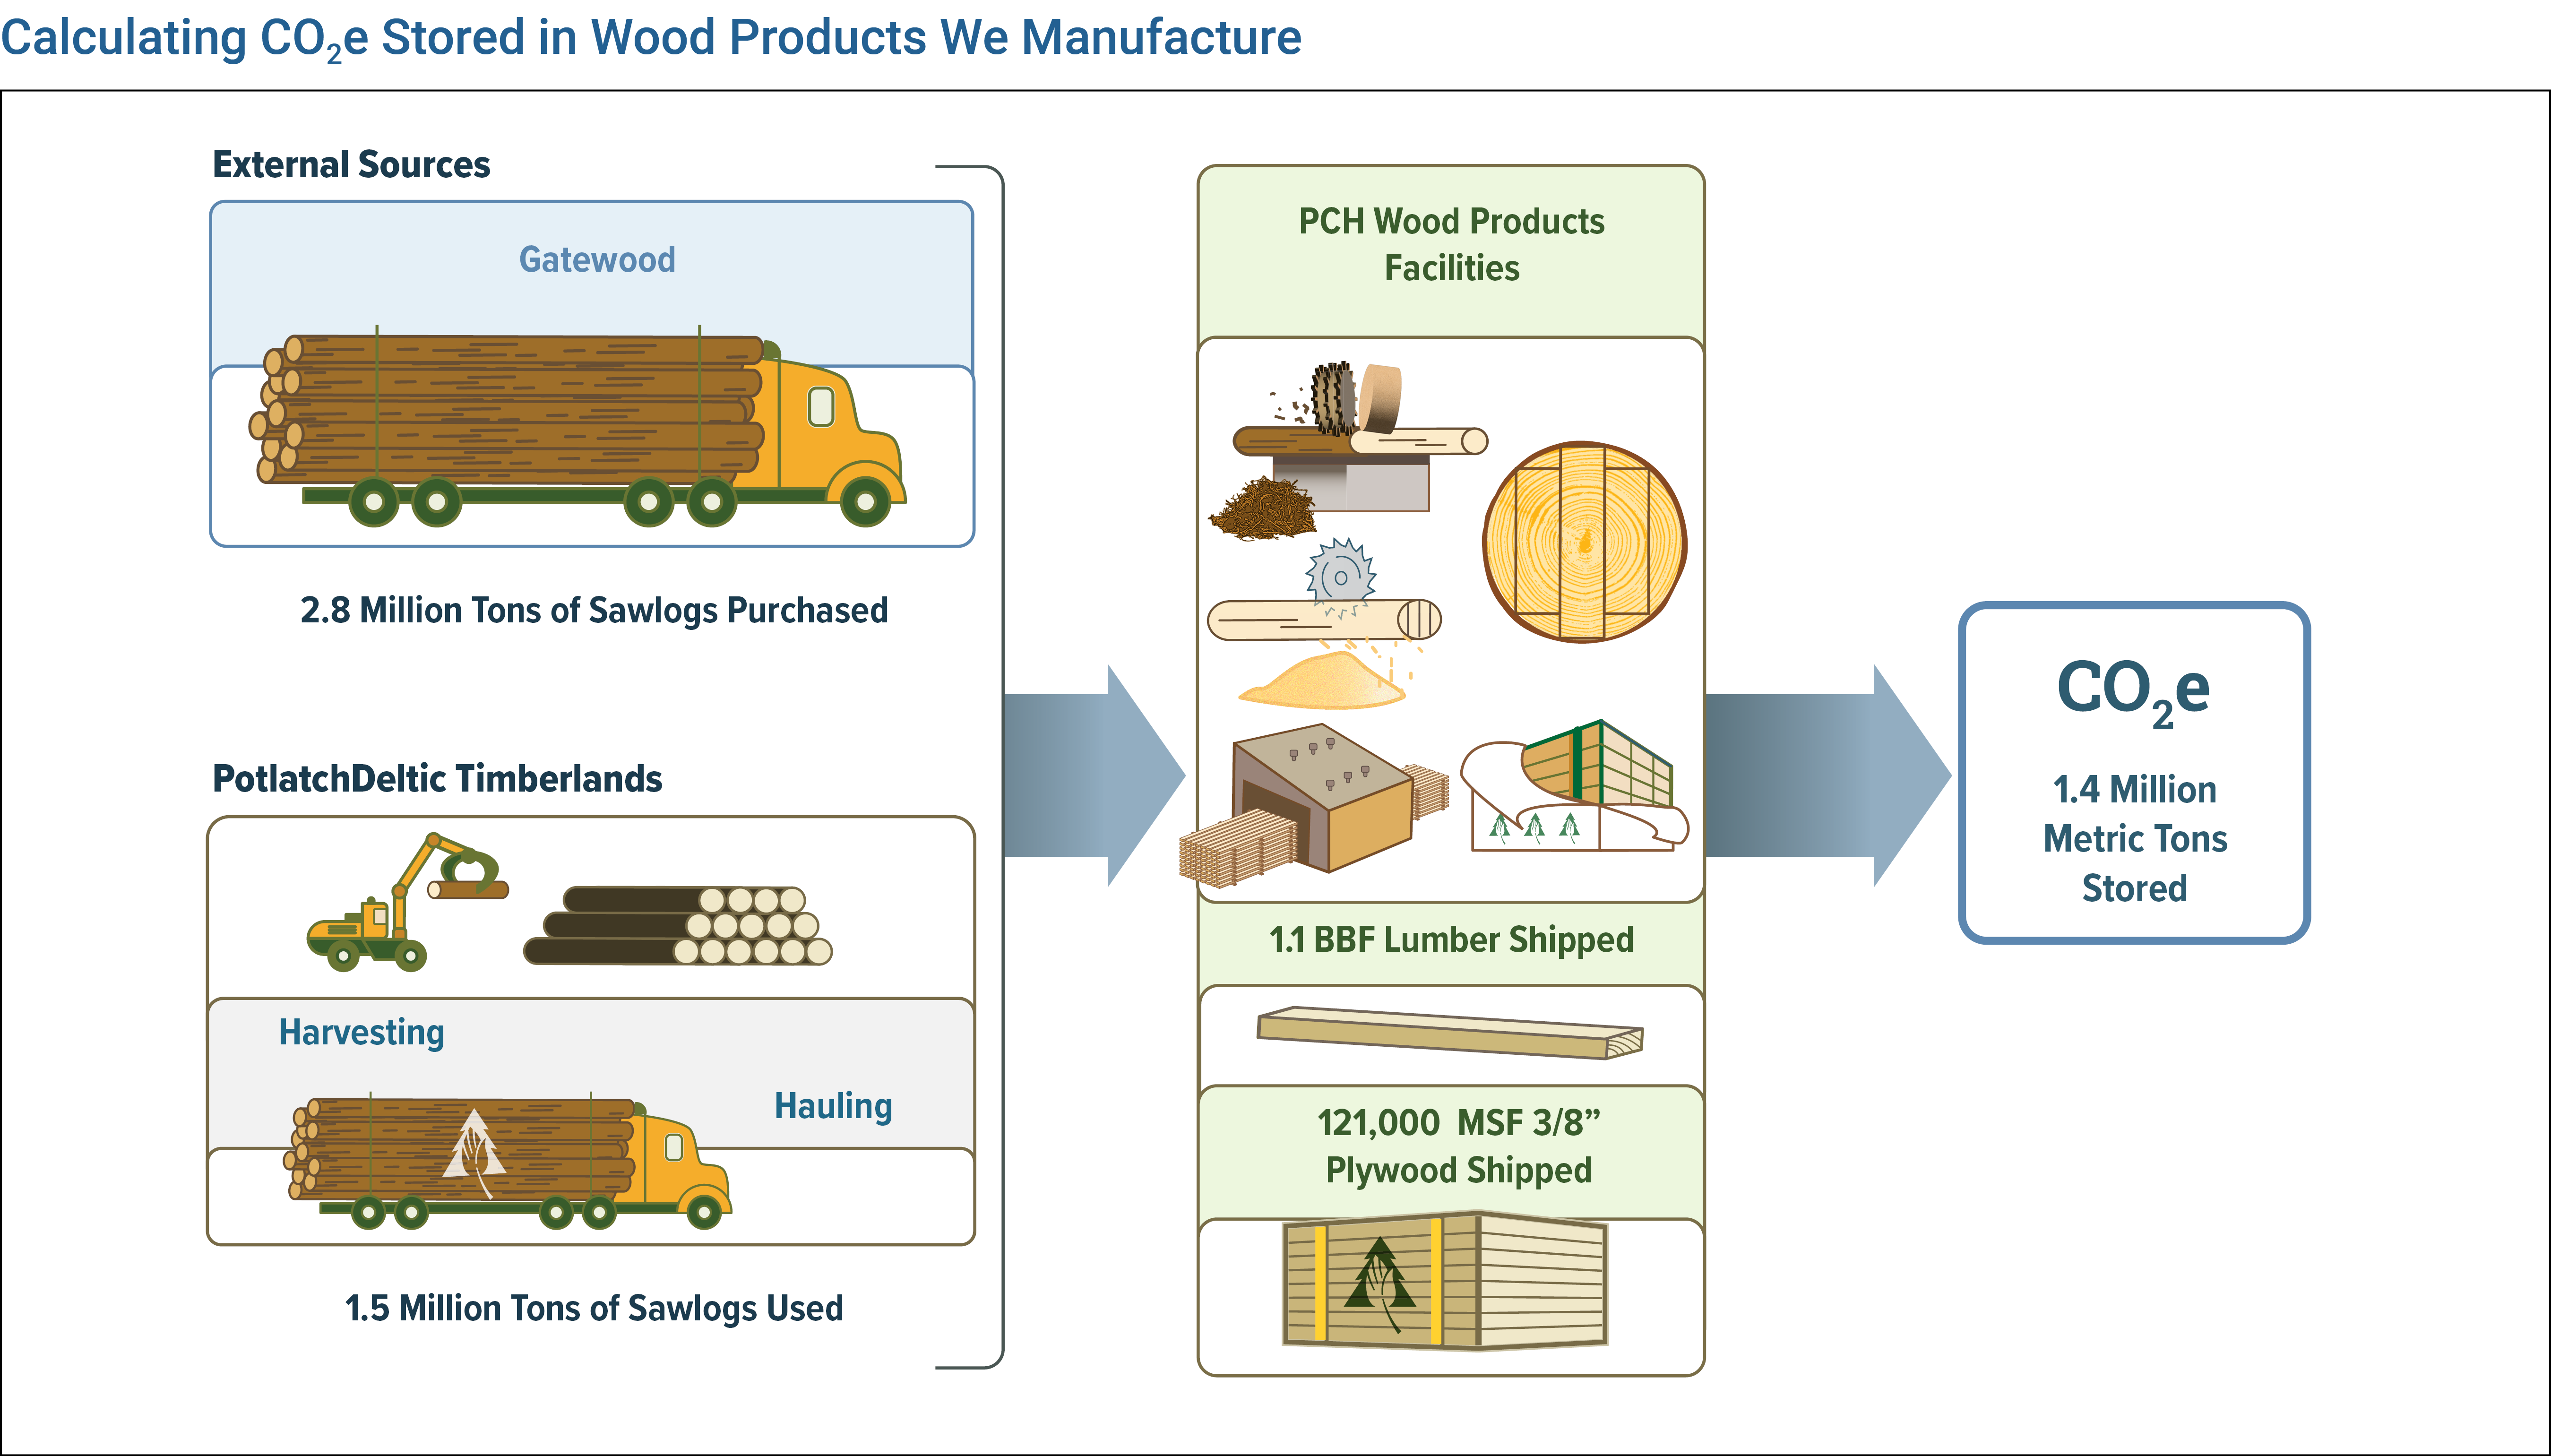
The trees grown on our timberlands are grown and harvested using sustainable long-term, five-year, and annual forest management plans. In 2024, about 19% of the logs we harvested, or approximately 1.5 million tons of sawlogs from our timberlands, were used in our wood products facilities. An additional 2.8 million tons of sawlogs were purchased by our mills from external sources. These logs were manufactured by our wood products facilities into lumber and industrial plywood.
These wood products store carbon by remaining in use, with slow reversals over their lifetime. The storage values were developed using decay curves for specific wood products that have been identified in the USDA’s report, Quantifying Greenhouse Gas Fluxes in Agriculture and Forestry: Methods for Entity-Scale Inventory (Table 6-a-5 and Table 6-a-6).5 Since the amount of carbon stored in a wood product decreases as the time since production increases, we use the average quantity of carbon stored over a 100-year period.
In 2024, we sold 1.1 billion board feet of lumber and 121 million square feet (3/8”) of industrial and structural plywood. Using our GHG methodology, these wood products are expected to store an average of approximately 1.4 million metric tons of CO2e over the next 100 years.
SCOPE 3: STORED IN WOOD RESIDUALS WE SELL
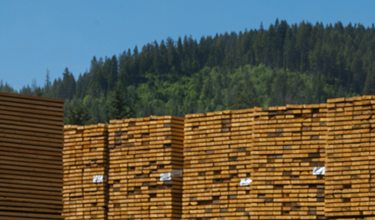
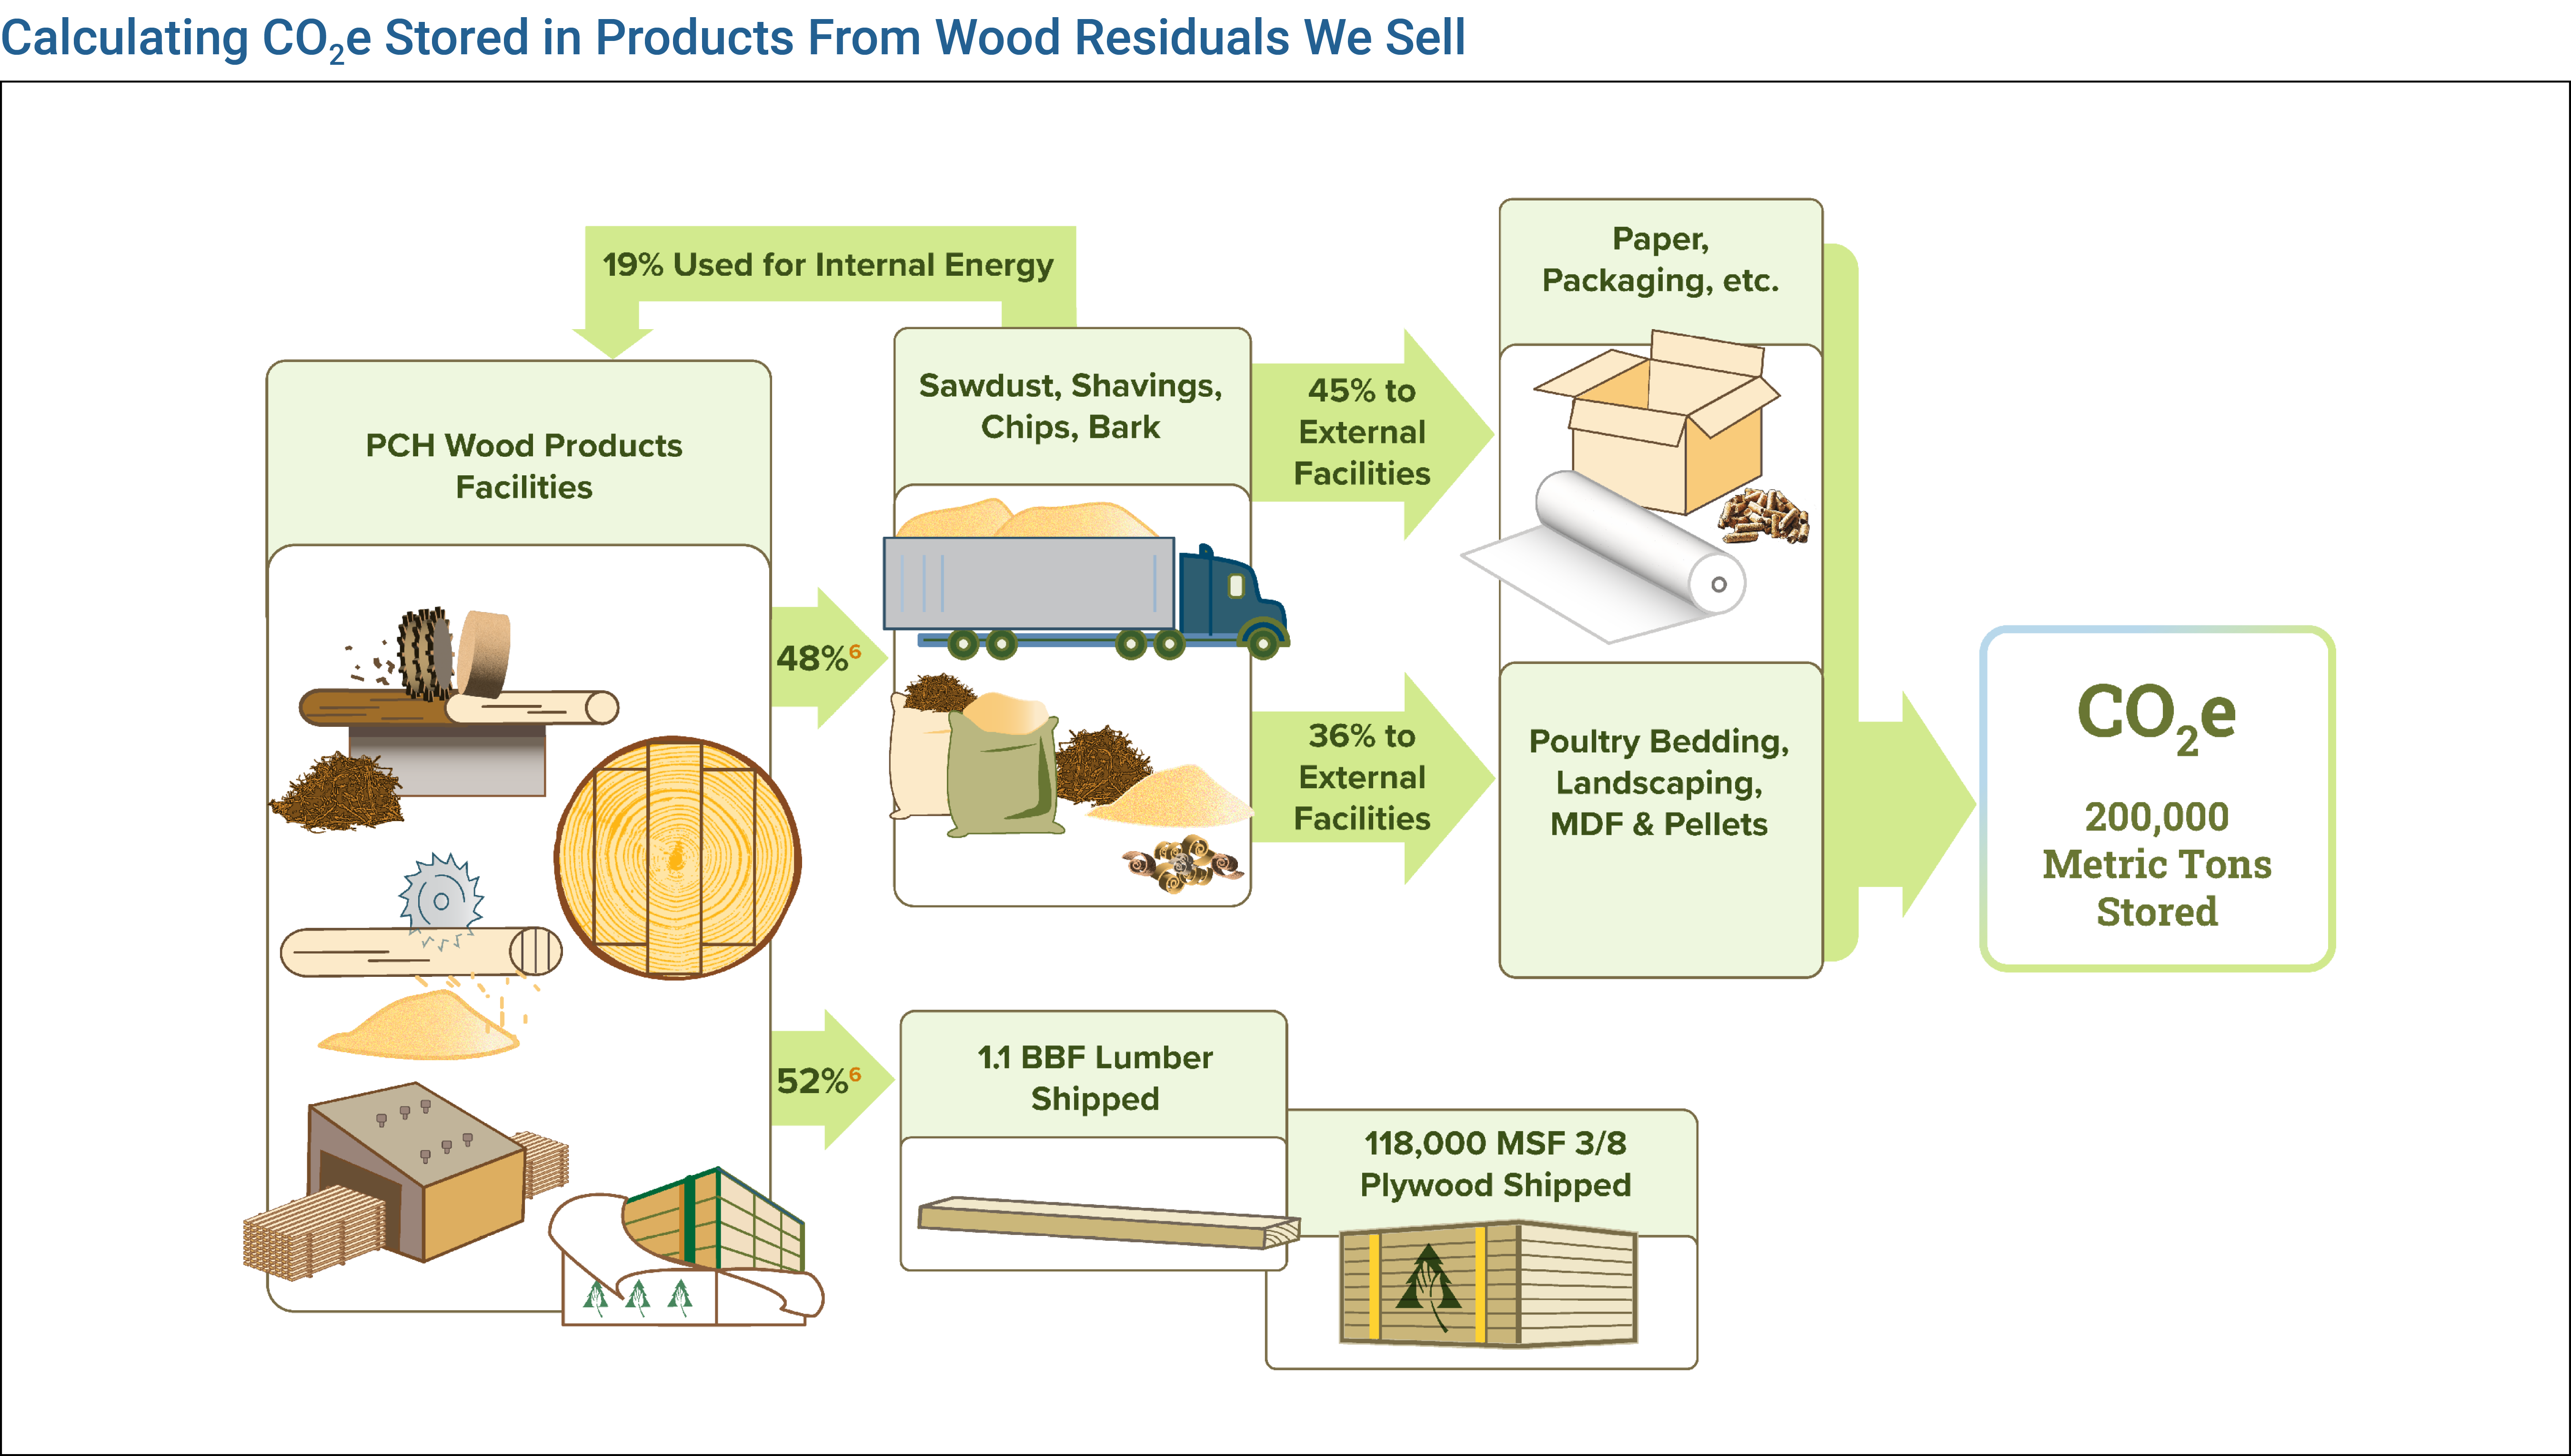
When a log is prepared to be sawn at our mills, we maximize the value of each log and minimize residuals. At most mills, 3D scanners and optimizers are used to automate the process. The full profile of the log is scanned which creates a computerized image of each log. The optimizer then selects the cuts of the log and how the log should be oriented to maximize value (including the number of boards to be cut) and minimize waste. This process increases productivity and quality at the mill. Overall, about 52% of each log is processed into lumber, with the remaining wood residuals consisting of sawdust, chips, shavings, and bark. These by-products can be used internally to produce biogenic energy or sold externally to be converted into a wide range of other wood products, paper and packaging products, or other end uses. Substantially all of the log is utilized.
In 2024, our wood products facilities utilized an average of 19% of the wood residuals they produced for fuel in their boilers to generate thermal energy in the form of steam and approximately 81% of the wood residuals were sold for a wide range of end uses. We estimate the average carbon stored in the wood residuals sold and we do not include the carbon stored in internally utilized wood residuals in that estimate.
In 2024, our wood products facilities sold approximately 1.8 million metric tons of wood residuals. Using our GHG methodology, the end use products from these residuals are expected to store an average of approximately 300,000 metric tons of CO2e over the next 100 years.
- Alexander Clark and Richard F. Daniels, “Estimating Moisture Content of Tree-Length Roundwood,” Pulping/Process and Product Quality Conference, Sheraton Boston (2000): https://www.fs.usda.gov/research/treesearch/9741
- J. Jenkins et al., “National Scale Biomass Estimators for United States Tree Species,” Forest Science, no. 49 (February 1, 2003): https://www.fs.usda.gov/research/treesearch/6996
- Grant M. Domke et al., “Greenhouse Gas Emissions and Removals from Forest Land, Woodlands, Urban Trees, and harvested Wood Products in the United States, 1990-2021,” U.S. Department of Agriculture, Forest Service, Northern Research Station Resource Bulletin WO-101 (April 2023): https://doi.org/10.2737/WO-RB-101
- AFF/NCASI Carbon tool: https://ncasi-shiny-tools.shinyapps.io/AFF_Project/
- M. Eve et al., “Quantifying Greenhouse Gas Fluxes in Agriculture and Forestry: Methods for Entity-Scale Inventory,” U.S Department of Agriculture, Technical Bulletin Number 1939 (July 2014): https://www.usda.gov/sites/default/files/documents/USDATB1939_07072014.pdf
- J. Bowyer et al. "Utilization of Harvested Wood by the North American Forest Products Industry," Dovetail Partners Inc., (October 8, 2012): https://dovetailinc.org/report_pdfs/2012/dovetailwoodutilization1012.pdf


Greenhouse Gas Emissions
SCOPE 1: DIRECT EMISSIONS FROM OUR OPERATIONS
Scope 1 emissions are greenhouse gas (GHG) emissions that are emitted directly from our activities in our corporate, our timberlands, our wood products facilities, and real estate operations. These emissions are emitted from stationary sources and associated control devices (boilers, kilns, dryers, and a regenerative catalytic oxidizer (RCO)), mobile sources (fork trucks, log yard equipment, company-owned vehicles), long-term storage of wood residuals at our mills, and the methane (CH4) and nitrous oxide (N2O) emissions from biomass combustion.
To consistently calculate Scope 1 emissions, we use the National Council for Air and Stream Improvement (NCASI) tool. This approach uses methodology and emission factors consistent with guidance from the International Panel on Climate Change, and it reflects widely accepted protocols such as the Greenhouse Gas Protocol. This tool calculates CO2, CH4, and N2O emissions from wood products manufacturing facilities and their ancillary operations. Scope 1 emissions from our timberlands and real estate segments are also calculated with this methodology.
The calculations involve the following:
- For each site, we use our purchasing records and standardized emission factors to calculate CO2-equivalent (CO2e) emissions resulting from fossil fuels usage.
- For each site, we use our steam production records to calculate biomass usage and subsequent biogenic CO2 emissions (excluded from Scope 1) and remaining CO2e emissions (CH4, N2O).
- For sites with long-term residuals storage, we calculate the quantity of residuals onsite, use a methane generation rate, and apply a standardized Global Warming Potential (GWP) to estimate CO2e emissions.
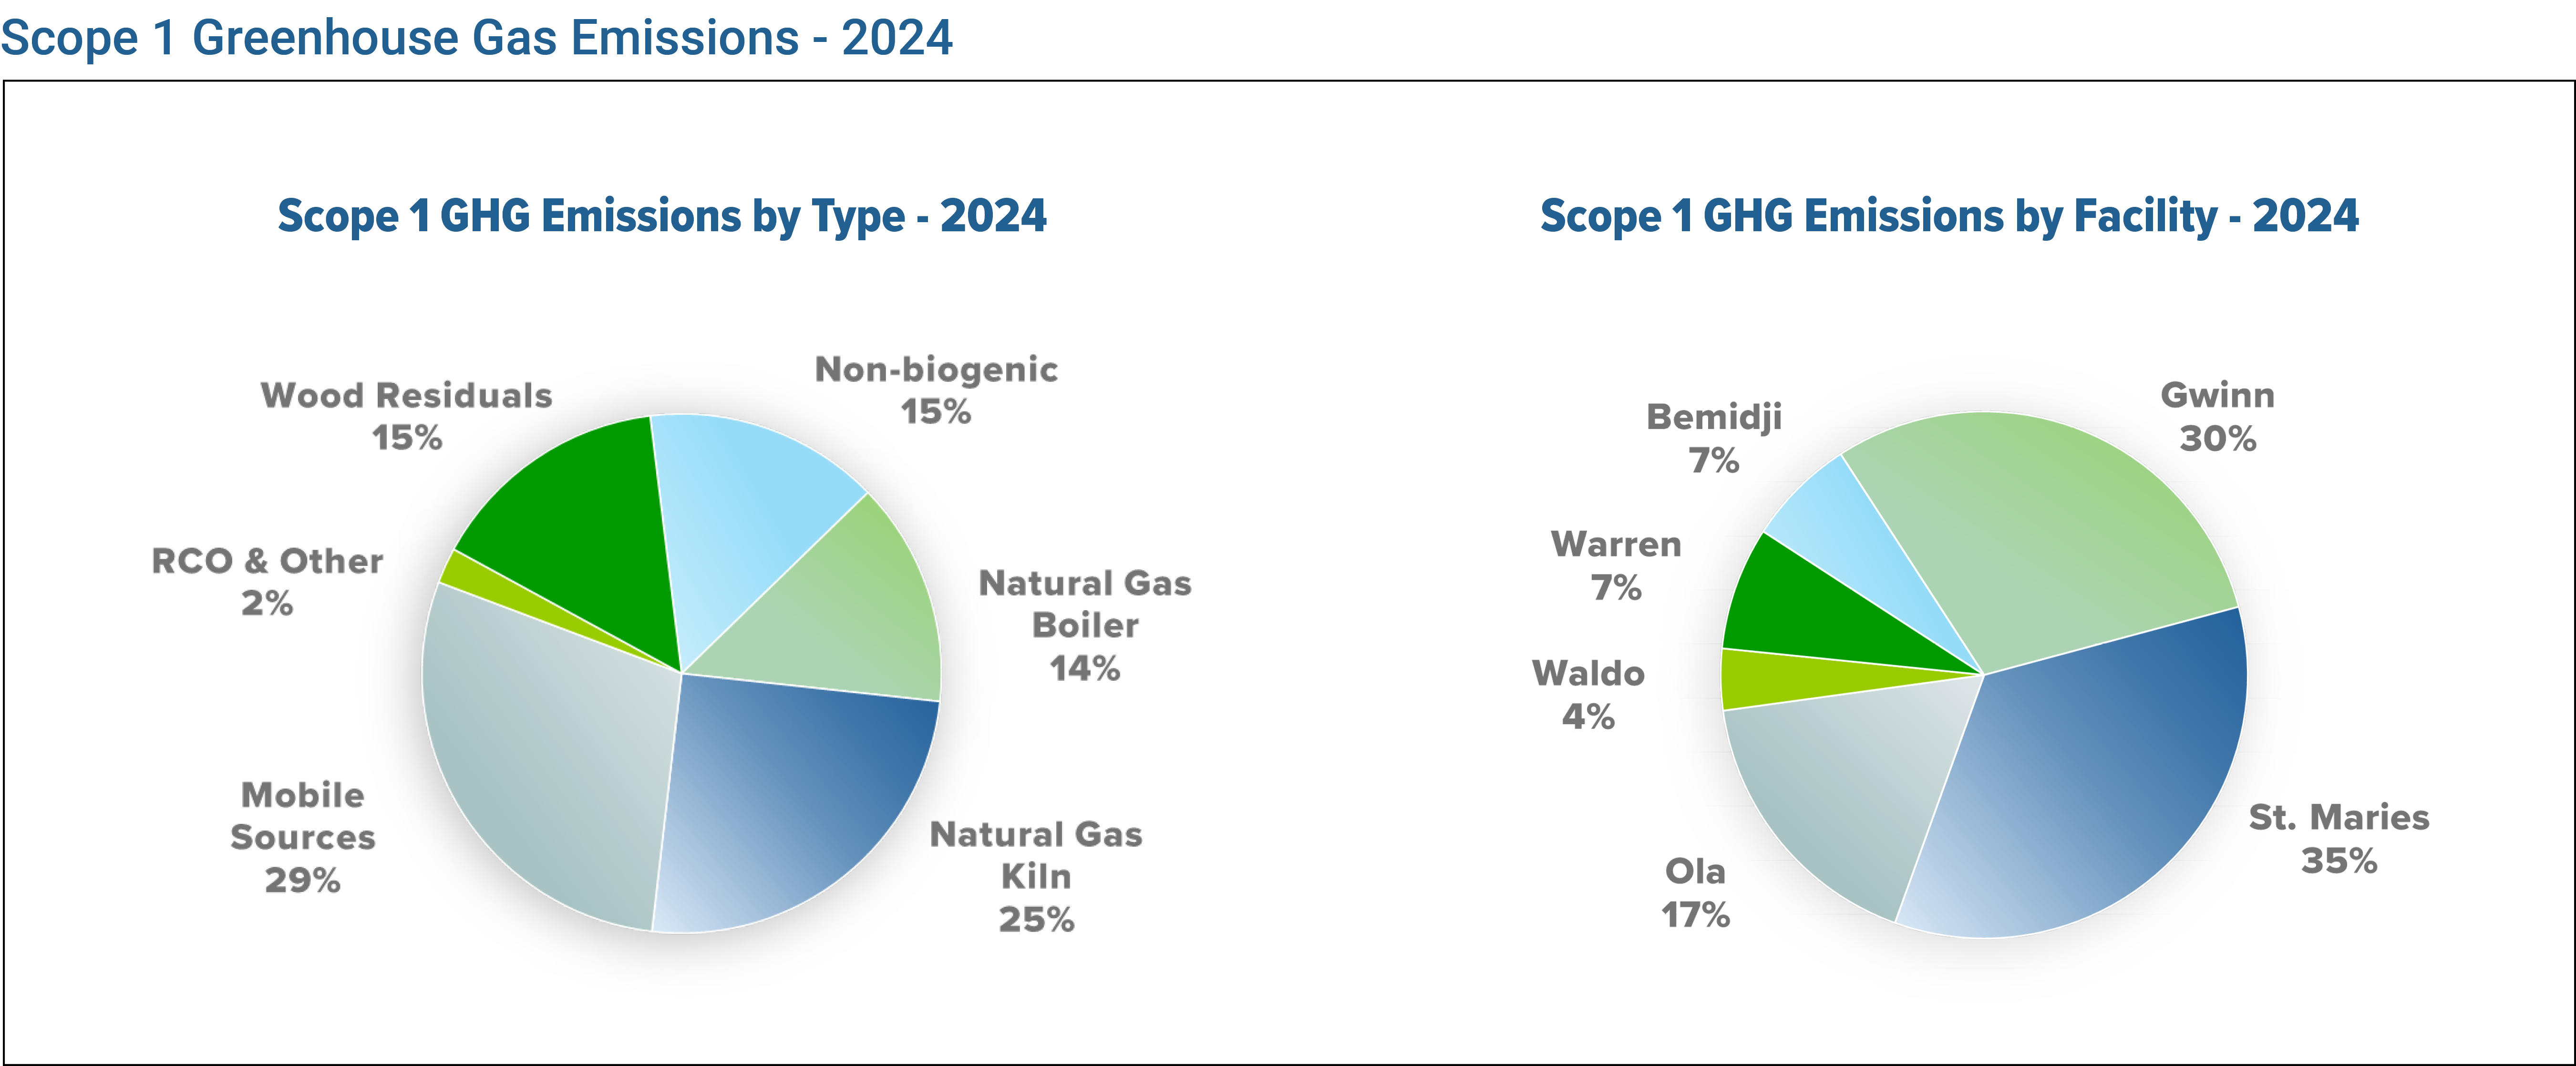
Our consolidated 2024 Scope 1 emissions were approximately 45,000 metric tons CO2e with 15% from non-biogenic emissions from biomass combustion,3 39% from natural gas-fired boilers and kilns, 29% from mobile sources, 15% from long-term storage of wood residuals, and 2% from pollution control equipment. Scope 1 emissions increased from 2023 to 2024 primarily due to a full year of output from the direct-fired kiln burner installed in 2023 at our Ola, Arkansas facility, as well as increases in output from the boiler and natural gas kiln at our Gwinn, Michigan facility. Partnering with our Arkansas utility provider, Entergy, we were able to secure alternative emissions credits and renewable energy credits to offset the forecasted emissions of the new burner as part of our Scope 2 reduction efforts.
Over 99% of our Scope 1 emissions are from our wood products facilities with less than 0.1% from Timberlands and Real Estate. Within wood products Scope 1 emissions, our Gwinn, Michigan wood products facility accounts for 30% of GHG emissions with higher emissions the result of the use of natural gas to fire a boiler and a direct-fired kiln. Our facility at St. Maries, Idaho has higher GHG emissions as a result of the facility being comprised of both a sawmill and a plywood mill, long-term wood residuals storage, and a regenerative catalytic oxidizer (RCO) for pollution control.
Emissions generated from biogenic carbon occur from the production of energy fueled by the use of wood residuals at our wood products facilities. These emissions in 2024 were 500,000 metric tons of CO2 and were not included in our GHG direct Scope 1 emissions. Biogenic CO2 emissions can be considered carbon neutral given the residual wood used for energy has a net sequestration benefit as areas harvested are replanted and the CO2 absorption cycle is renewed as the forests grow. These biogenic emissions are also not additive to the carbon released into the atmosphere because they are considered part of the natural carbon cycle and as a result, are preferable to the alternative use of fossil fuels.
SCOPE 2 – INDIRECT EMISSIONS FROM ELECTRICITY PROVIDERS
Scope 2 emissions are GHG emissions associated with the production of the grid electricity used at our facilities and offices. For the electricity used onsite, there are emissions offsite associated with the production of that electricity. These emissions vary depending on the method of production of the electricity, with fossil fuels having high emission factors and renewable sources having low emission factors. Emission factors for electricity production vary by region and source of the grid electricity. Although these emissions are indirect, the user has some control over the amount of electricity used.
There are two methods for calculating Scope 2 emissions. The GHG Protocol Scope 2 Guidance defines both methods. A location-based method reflects the average emissions intensity of grids on which energy consumption occurs (using grid-average emissions factor data). A market-based method reflects emissions from electricity that companies have purposefully chosen. This method would include any type of contract with a utility and can account for renewable energy credits (RECs), Alternative Energy Credits (AEC’s), or other energy attribute certificates. To calculate the emissions associated with our electricity usage, we use the same NCASI tool as used in Scope 1, which follows the GHG Protocol. We calculate Scope 2 emissions using both location-based and market-based methods. Location-based Scope 2 emissions are calculated with regional emission factors, while market-based Scope 2 emissions are calculated with utility-specific emission factors.
The calculations involve the following:
- For each site, we collect electricity purchasing records and consolidate electricity usage by site.
- For location-based Scope 2 emissions, we apply a regional GHG emissions factor from the Environmental Protection Agency (EPA) Emissions & Generation Resource Integrated Database (eGRID) for each site. Emissions are calculated for CO2, CH4, and N2O emissions, which are then adjusted to CO2e with standardized GWPs.
- For market-based Scope 2 emissions, we apply a utility-specific emissions factor from the utility serving each site. Emissions are calculated for CO2, CH4, and N2O emissions, which are then adjusted to CO2e with standardized GWPs.
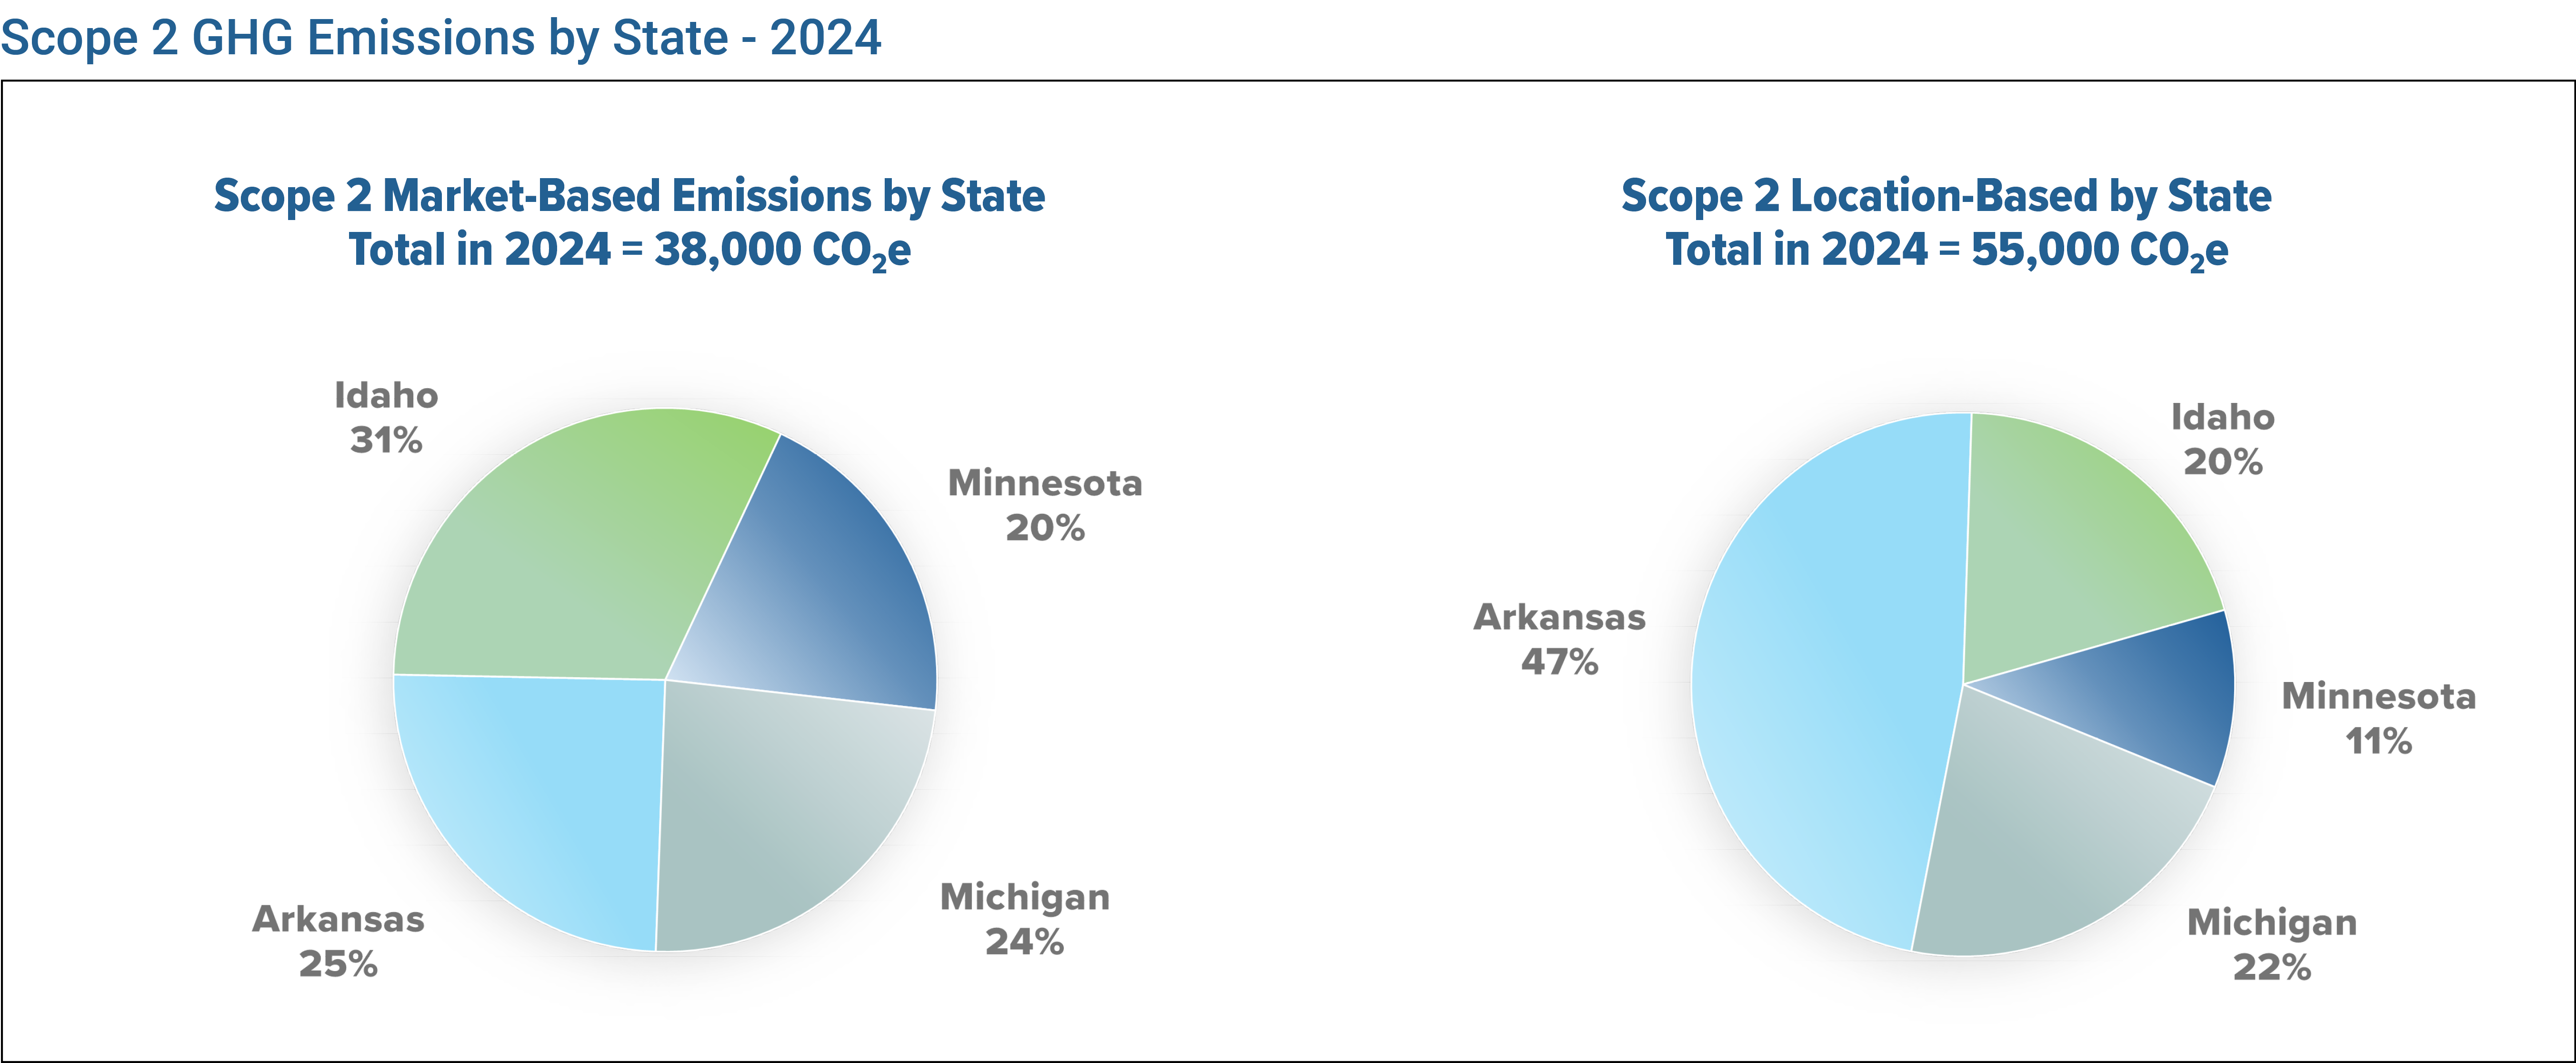
Our consolidated location-based Scope 2 GHG emissions were approximately 55,000 metric tons of CO2e in 2024, using the most up to date emission factors from EPA’s eGRID.4 Our market-based Scope 2 emissions were 38,000 metric tons of CO2e in 2024, using the most up to date utility-specific emission factors from our electricity providers.
While our location-based Scope 2 emissions calculations show a higher emissions quantity, the market-based approach is a more precise approach since it is using the emission factors with our specific electricity providers. Our market-based Scope 2 emissions calculation is lower because our electricity provider in Arkansas has a much lower emission rate for electricity production than the Arkansas state average emission rate and includes any REC/AEC impacts. We have three facilities in Arkansas, so this results in a lower market-based Scope 2 emissions calculation.
Our 2024 market-based Scope 2 emissions increased from the previous year due to the increase of Scope 2 emission factors from some our electricity utility providers. We continued our Green Promise RECs contract and a Go Zero contract for AECs and RECs in 2024 to further reduce our market-based Scope 2 emissions. Both AECs and RECs are third-party verified and come from low or no emissions sources. The Green Promise agreement includes 6.7 MW of solar capacity. The Go Zero agreement added an additional 2,550 KW of solar RECs plus AECs.
SCOPE 3 – INDIRECT EMISSIONS FROM VALUE CHAIN
Scope 3 emissions, or indirect emissions, are the GHG emissions associated with our upstream and downstream value chain. These emissions are divided into 15 categories. These categories represent a wide array of emissions ranging from products and services that are paid for, to assets leased to other entities.
To consistently calculate Scope 3 emissions, we used the NCASI Scope 3 Screening Tool. This tool calculates Scope 3 emissions conservatively using an 80% confidence estimate. Using fiber flows, we use the Screening Tool to calculate Scope 3 emissions for categories 1 (Purchased Goods and Services), 3 (Fuel-Energy-Related Activities), 4 (Upstream Transportation), 9 (Downstream Transportation), 10 (Processing of Sold Products), and 12 (End-of-Life for Sold Products).
The calculations involve the following:
- We consolidate all accounting records for log sales from our Timberlands business.
- We apply the latest emission factors according to new studies documenting the lifecycle of products we or our customers produce through industry partners.
- We assign product categories to our Timberlands deliveries, with the associated tonnage being tailored to a specific Category 12 emission factor.
- We consolidate all accounting records for our Wood Products business for log purchases, primary product (lumber, plywood) shipments, and secondary product (wood residuals) shipments.
- We convert all fiber data to dry weight.
- We consolidate Scope 1 and Scope 2 CO2e emissions.
- We input fiber flow data into the NCASI Screening Tool.
- We account for Wood Products business log purchases.
- We account for Wood Products business primary and secondary product sales.
- We account for Timberlands business log sales.
- We apply appropriate emission factors for bark and planer shavings, matching the sawdust default emissions factor for categories 1, 9, 10, and 12.
- We input Scope 1 CO2e emissions to calculate upstream processing and distribution emissions for fuels.
- We input Scope 2 CO2e emissions to calculate transmission and distribution losses of electricity.
- We exclude Scope 3 indirect emissions associated with our Real Estate business because they are de insignificant as established by an analysis of 2021 data.
Company-wide consolidated 2024 Scope 3 emissions were approximately 3,200,000 metric tons of CO2e using market-based Scope 2 emissions.5 Upstream Scope 3 emissions were approximately 300,000 metric tons of CO2e and downstream Scope 3 emissions were approximately 2,900,000 metric tons of CO2e. Scope 3 emissions increased by approximately 100,000 metric tons of CO2e primarily due to product flow shifts and higher wood residual sales.
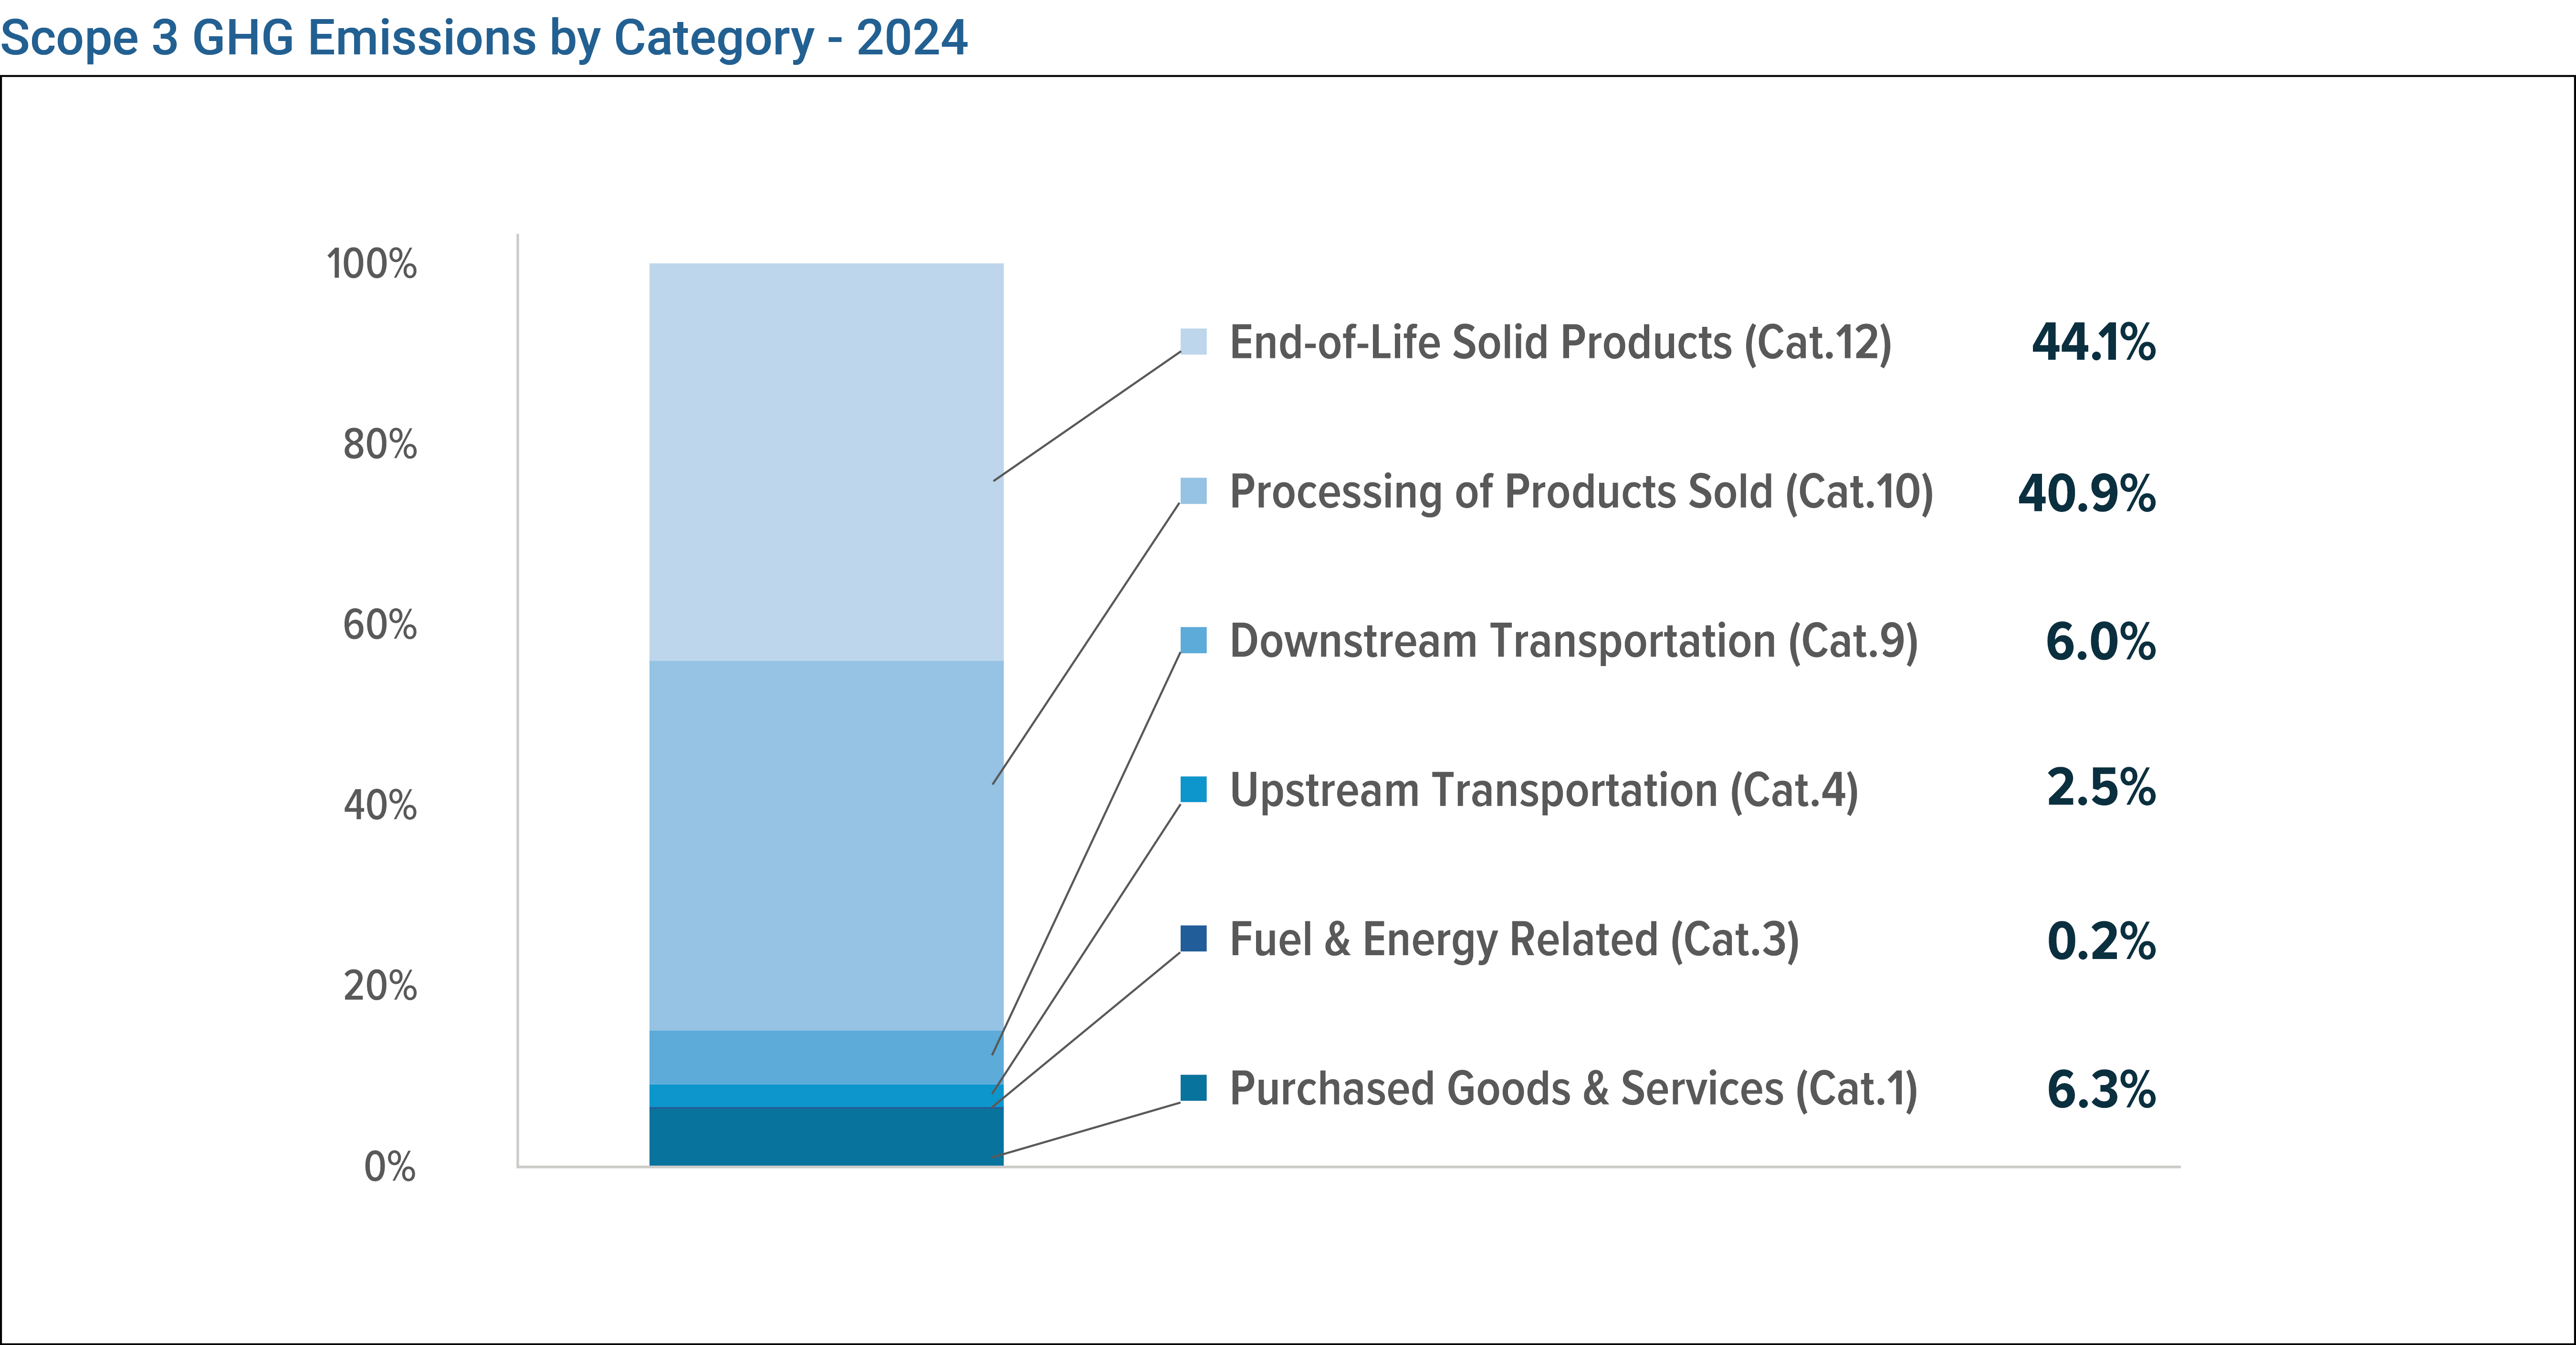
Category 1: Purchased Goods and Services made up 6.4% of Scope 3 emissions and included emissions from professional services, telecommunications services, and wood fiber.
Category 3: Fuel- Energy-Related Activities made up 0.2% of Scope 3 emissions and included energy losses from transportation and distribution of purchased energy in Scope 2, and any other utility or fuel information not covered by Scope 1 or Scope 2.
Category 4: Upstream Transportation and Category 9: Downstream Transportation resulted in 2.5% and 6.0% of our calculated Scope 3 emissions, respectively.
Category 10: Processing of Sold Products includes emissions from our sold logs and sold residuals that are processed in our customers’ mills and represented 40.9% of our Scope 3 emissions.
Category 12: End-of-Life of Sold Products is the emissions from the recycling, landfilling, and disposal of our sold products and was 44.1% of our Scope 3 emissions.
Other Scope 3 categories resulted in insignificant amounts of Scope 3 emissions, as discussed below. Overall, upstream emissions (including harvesting, hauling, and purchased materials and services) accounted for 9% of our Scope 3 emissions.
The rationale for not including the remaining categories is described below:
Category 2: Capital Goods. Scope 3 emissions associated with the purchase of capital goods has not been recognized as being a significant source of emissions in our industry. A general review of the emissions associated with the purchase of capital goods supports this assumption at this time.
Category 5: Waste Generated in Operations. The majority of materials that could become waste from our operations are wood residuals which are either utilized for energy production (via biomass boilers) or used for other products by our downstream customers. Emissions from biomass combustion are a renewable source of energy and get reported as biogenic emissions. Emissions from materials sent to downstream customers get calculated in Category 10 of our Scope 3 inventory. We do have some long-term storage of woody debris onsite, which is reported as part of our Scope 1 emissions as methane emissions.
Category 6: Business Travel. We reviewed emissions from business travel utilizing travel expenses from our accounting data. The analysis included air travel, hotels, rental car mileage, and mileage reimbursement (for mileage driven in private vehicles for business purposes). This did not result in a significant amount of Scope 3 emissions.
Category 7: Employee Commuting. Previous calculations of employees’ commuting using typical commuting habits from Census Bureau data and EPA emissions factors showed that these emissions were insignificant for Scope 3 emissions.
Category 8: Upstream Leased Assets. Although we lease mobile equipment for use at our mills, the fuel used in that equipment is captured in Scope 1 emissions.
Category 11: Use of Sold Products. No emissions result from the use or operation of our sold products. Separately, we account for carbon stored in our wood products as part of our removals.
Category 13: Downstream Leased Assets. We lease some of our land for recreation and the development of solar power generation facilities, and we lease some mineral rights. Neither recreation nor solar development account for a significant quantity of emissions, and a preliminary quantification of mineral rights activity showed that it is an insignificant amount of Scope 3 emissions.
Category 14: Franchises. This category does not apply to us since we do not operate franchises.
Category 15: Investments. This category does not apply to us.
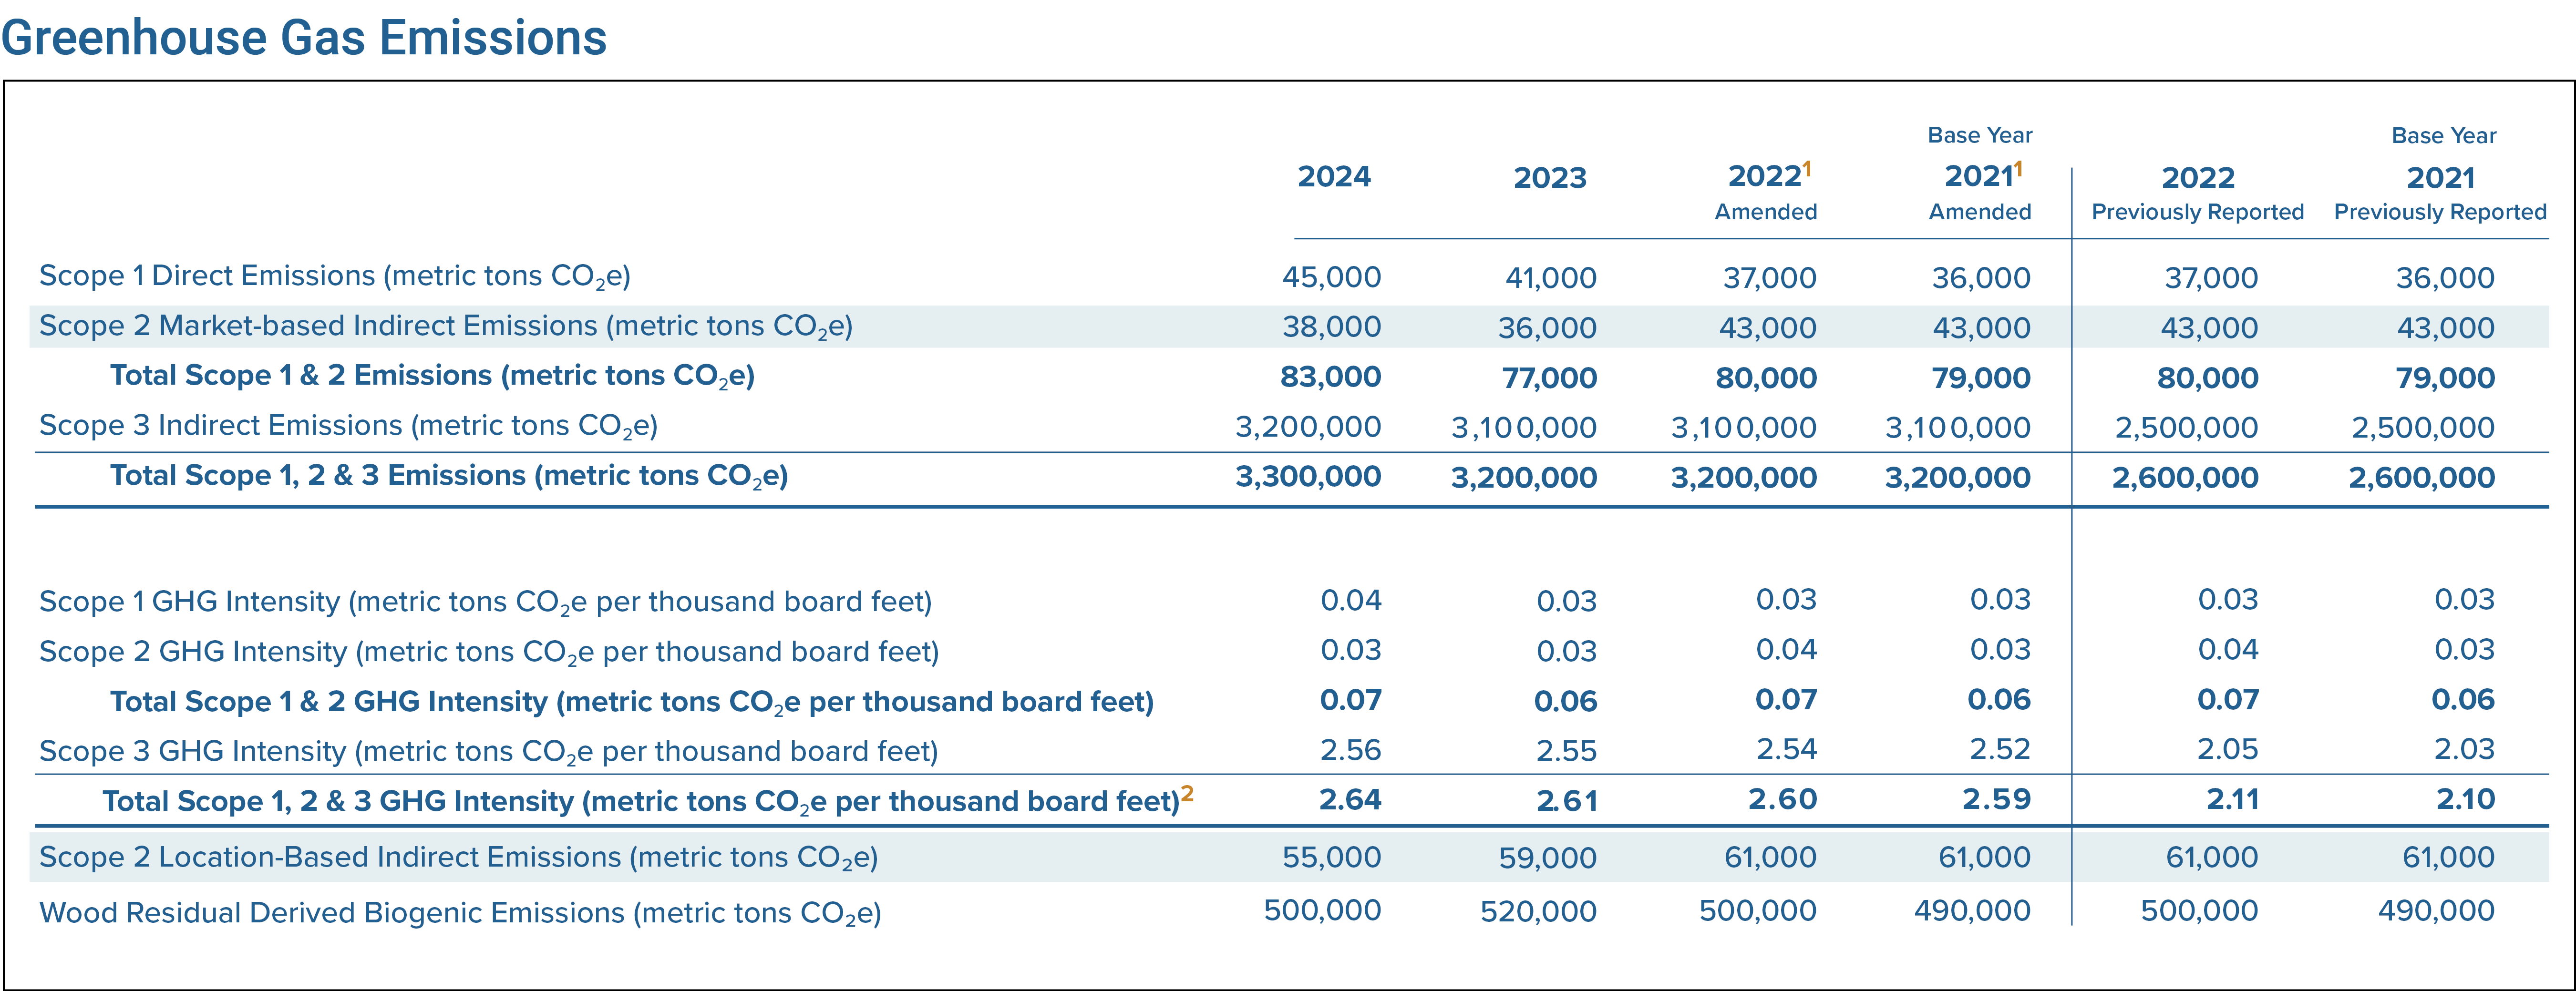
- GHG Intensity = Total Scope 1, 2, and 3 emissions per total division production.
- 2021 and 2022 calculations are amended to reflect the addition of CatchMark Timber Trust on September 14, 2022. The GHG Protocol requires previous years’ GHG calculations to be amended to estimate the impacts of significant events, such as a merger.
- Greenhouse gas emissions estimates are based on the methods outlined in NCASI Report Calculation Tools for Estimating Greenhouse Gas Emissions from Wood Products Facilities Version 1.0 and associated workbook NCASI Spreadsheets for Calculating GHG Emissions from Wood Products Manufacturing Facilities Version 1.0. CO2e (CO2-equivalent emissions) is a term for describing different greenhouse gases in a common unit. For any quantity and type of greenhouse gas, CO2e signifies the amount of CO2 which would have the equivalent climate change impact. For PotlatchDeltic, CO2e emissions include emissions of carbon dioxide (CO2), methane (CH4), and nitrous oxide (N2O).
- 2024 Location-Based Scope 2 emissions were calculated with the 2023 eGRID factors that were released in January 2025, which are available here: https://www.epa.gov/egrid/detailed-data.
- Scope 3 emissions were calculated with NCASI’s workbook, NCASI Scope 3 Greenhouse Gas Screening Tool, Version 1.1, and fiber flow data.
Greenhouse Gas Initiatives
We are committed to reducing our Scope 1 and Scope 2 greenhouse gas emissions and working with our value chain on indirect Scope 3 emission reductions.
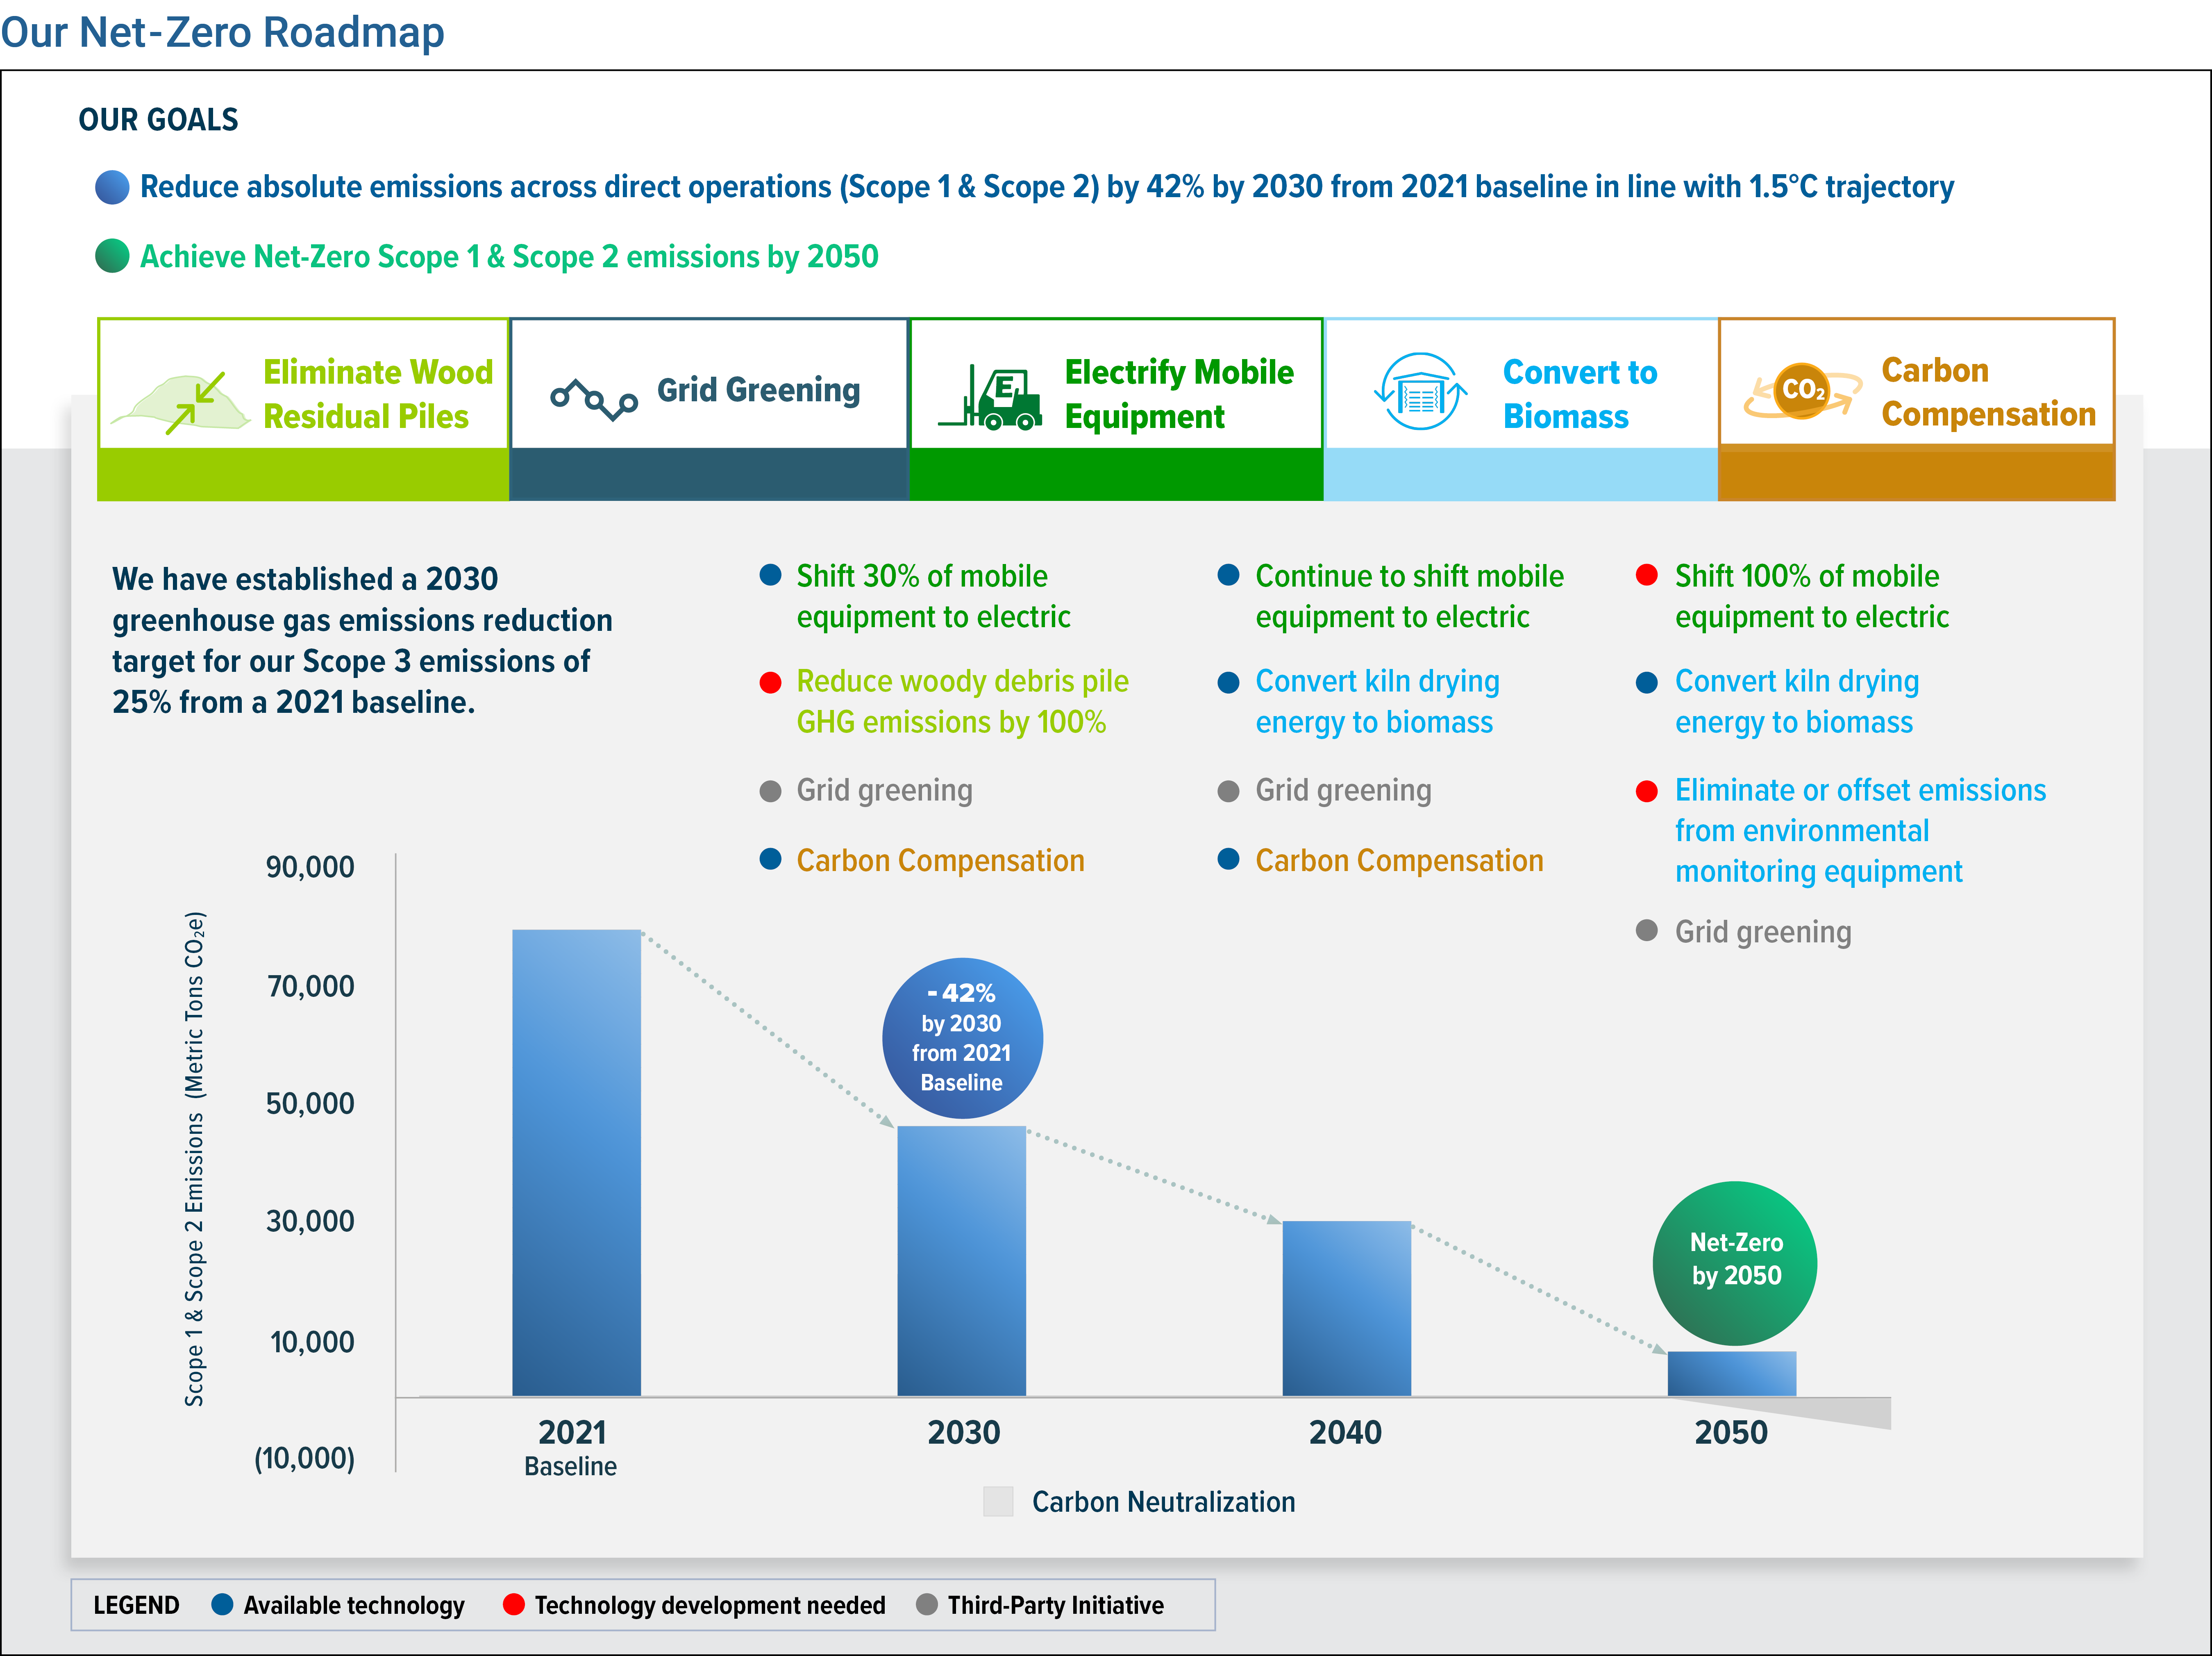
We have established a 2030 greenhouse gas emissions reduction target for our Scope 1 and Scope 2 emissions of 42% from our 2021 baseline. This reduction target is in accordance with initiatives to keep global temperature increases to less than 1.5°C compared to preindustrial levels. We have also committed to achieve net-zero GHG emissions by 2050. We estimate that over 99% of our Scope 1 and Scope 2 emissions are associated with our wood products facilities.
Within our Scope 1 and Scope 2 emissions, reduction plans include the elimination of wood residual piles, a shift to electrify mobile equipment, the conversion of the natural gas boiler and direct-fired burner at our Gwinn, Michigan facility and the conversion of our natural gas kiln burner at our Ola, Arkansas facility, and grid greening initiatives by our utility providers. Carbon compensation such as the use of alternative energy credits and renewable energy credits may be needed if technological challenges or slower utility reduction implementation impacts our plans. Carbon neutralization would be used to offset greenhouse gas emissions that cannot be eliminated.
We have established a 2030 greenhouse gas emissions reduction target for our Scope 3 emissions of 25% from a 2021 baseline. This reduction target is in accordance with initiatives to keep global temperature increases to less than 1.5°C compared to pre-industrial levels.